
- Title
-
A diffusible signal derived from hematopoietic cells supports the survival and proliferation of regenerative cells during zebrafish fin fold regeneration
- Authors
- Hasegawa, T., Nakajima, T., Ishida, T., Kudo, A., Kawakami, A.
- Source
- Full text @ Dev. Biol.
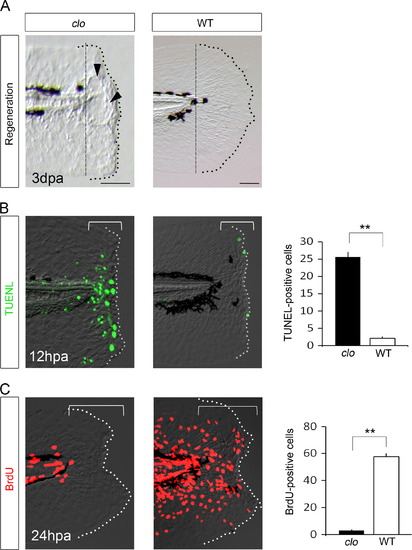
Unique regeneration defects in the clo mutant. (A) Impaired fin fold regeneration in the clo mutant and normal regeneration in the sibling wild-type. The arrowheads mark the characteristic blister-like structures often observed in the amputated mutant tissue. The dashed line indicates the site of amputation. (B) TUNEL analysis of amputated fin fold of clo mutant and sibling wild-type at 12 hpa. The graph in the right shows the quantification of TUNEL-positive cells in the clo mutant (n=25) and wild-type (n=28) in the regeneration-responsive region (brackets). (C) BrdU analysis of cell proliferation. The BrdU labeling was performed 0–24 hpa. The graph shows the quantification of BrdU-positive cells in clo mutant (n=7) and wild-type (n=7) in the bracketed regions. Data are presented as mean±s.e.m. Statistical significance was tested using Welchós t test. **P<0.001. The dotted lines indicate the outline of the fin fold. Scale bars for clo and wild-type represent 50 µm, respectively. dpa, days post amputation; hpa, hours post amputation. |

Temporal change of cell death in the clo mutant and wild-type after fin fold amputation. (A) TUNEL analysis of cell death at respective stages of fin fold regeneration in the clo mutant and wild-type. Note that mutant-specific cell death was only observed at 12 hpa and afterward. Scale bars for clo and wild-type represent 100 µm, respectively. (B) Quantification of TUNEL analysis. The TUNEL-positive cells in the bracketed areas in (A) were scored. Data are presented as mean±s.e.m. Statistical significance was tested using Welchós t test. **P<0.001. |
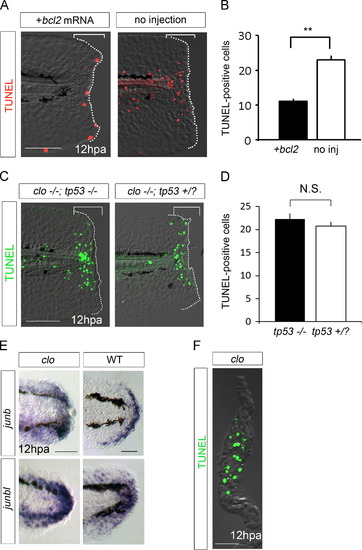
Cell death in the clo mutant is the apoptosis of primed regenerative cells. (A) TUNEL analysis during fin fold regeneration in the clo larvae that was injected or uninjected with bcl2 mRNA. clo-specific cell death (brackets) was significantly suppressed by Bcl2 overexpression. (B) Quantification of TUNEL-positive cells in (A). n=12 (injected) and 8 (uninjected), respectively. Data are presented as mean±s.e.m. Statistical significance was tested using Welchós t test. **P<0.001. (C) TUNEL analysis in the double mutants of clo and tp53. Apoptosis in the clo mutant (brackets) was not affected by the absence of tp53. (D) Quantification of the number of TUNEL-positive cells in (C). n=14 (clo-/-; tp 53-/-) and 27 (clo-/--; tp53+/?), respectively. (E) ISH analysis of junb and junbl, markers of the wound epidermis and blastema, respectively. Both markers were expressed in the clo mutant at higher levels than wild-type (n=7/7, respectively). (F) Horizontal cross section of clo fin fold that were made after TUNEL staining. Predominant localization of TUNEL-positive cells in the mesenchymal region in the clo mutant. The dotted lines in (A) and (C) indicate the outlines of fin folds. Scale bars represent 100 µm in (A) and (C), and 50 µm in (E) and (F). |
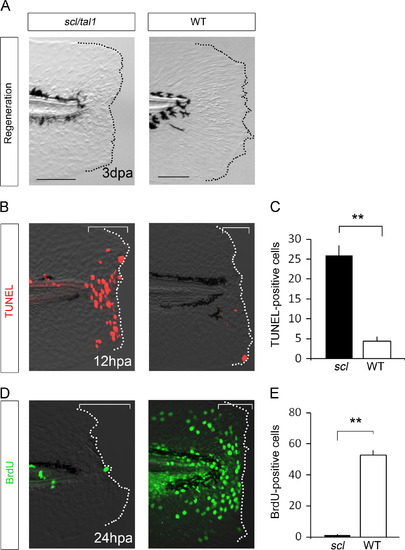
Regeneration phenotype in the tal1 mutant. (A) Regeneration of fin fold in the tal1 mutant and sibling wild-type at 3 dpa. Regeneration in the tal1 mutant was severely impaired. (B) TUNEL analysis of amputated fin fold in the tal1 and sibling wild-type at 12 hpa. (C) Quantification of TUNEL analysis. The graph shows the number of TUNEL-positive cells in the tal1 mutant (n=18) and wild-type (n=10). (D) BrdU analysis of cell proliferation of amputated fin fold in the tal1 and sibling wild-type. The BrdU labeling was performed 0–24 hpa. (E) Quantification of BrdU-positive cells. The graph shows the number of BrdU-positive cells in the clo mutant (n=6) and wild-type (n=7). The number of TUNEL and BrdU-positive cells was quantified in the bracketed areas. Data in (C) and (E) are presented as mean±s.e.m. Statistical significance was tested using Welchós t test. **P<0.001. The dotted lines indicate the outline of the fin fold. Scale bars for clo and wild-type represent 100 µm, respectively. |

Role of myeloid cells for the survival of regenerative cells. (A) TUNEL analysis of amputated fin fold in the vlad tepes mutant that lacks the red blood cells (n=21) and sibling wild-type (n=8) at 12 hpa. No significant increase of apoptotic cells was observed. (B) TUNEL analysis of amputated fin fold in the wild-type larvae treated with VEGFR inhibitor, PTK787 (n=39) or control vehicle (n=9). Impairment of blood vessel formation by the inhibitor did not induce apoptosis. (C) TUNEL analyses of amputated fin fold in larvae injected with the pu.1 MO (n=23) and control standard MO (n=7). Note the increase of TUNEL-positive cells in the pu.1 MO-injected larvae. (D) Quantification of TUNEL analyses (brackets) in (A–C). Data are presented as mean±s.e.m. Statistical significance was tested using Welchós t test. **P<0.001. N.S., not significant. (E) BrdU analyses of amputated fin fold in larvae injected with the pu.1 MO (n=9) and control standard MO (n=10). (F) Quantification of BrdU analyses (brackets) in (E). Data are presented as mean±s.e.m. Statistical significance was tested using Welchós t test. **P<0.001. The dotted line indicates the outline of the fin fold. Scale bars represent 100 µm. |
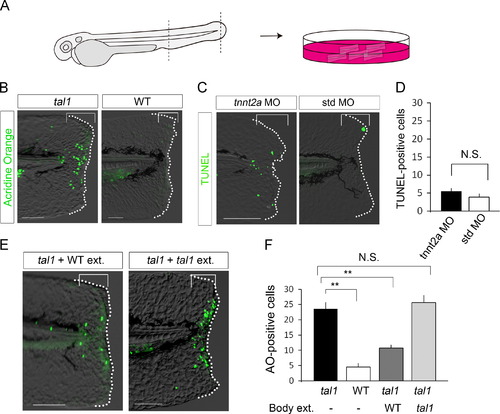
Rescue of apoptosis with the wild-type body extract. (A) Procedure of tail explant culture. Following fin fold amputation, the tail tissue was isolated and placed in the culture medium. At 12 hpa, acridine orange staining was performed to detect apoptotic cells. (B) Reproduction of the blastema apoptosis phenotype in the tail explant. Blastema apoptosis was detected in the mutant explant, but not in the wild-type one. (C) Detection of TUNEL-positive cells in the tnnt2a/silent heart morphant. Although almost all morphants did not have the heartbeat, no significant induction of apoptosis was observed. n=50 (tnnt2a MO) and 17 (standard control MO), respectively. (D) Quantification of the number of TUNEL-positive cells (brackets) in (C). (E) Rescue of the apoptosis in the tal1 mutant with the wild-type extract, but not the mutant one. Similar results were obtained more than three independent experiments. (F) Quantification of the number of TUNEL-positive cells in the explant culture. n=15 (tal1), 14 (WT), 13 (tal1+WT body fluid), and 14 (tal1+tal1 body fluid), respectively. Data in (D) and (F) are presented as mean±s.e.m. Statistical significance was tested using Welchós t test. **P<0.001. N.S., not significant. The dotted lines in (B), (C) and (E) indicate the outline of the fin fold. Scale bars represent 100 µm. |
Reprinted from Developmental Biology, 399(1), Hasegawa, T., Nakajima, T., Ishida, T., Kudo, A., Kawakami, A., A diffusible signal derived from hematopoietic cells supports the survival and proliferation of regenerative cells during zebrafish fin fold regeneration, 80-90, Copyright (2015) with permission from Elsevier. Full text @ Dev. Biol.