
- Title
-
Interferon Gamma Signaling Positively Regulates Hematopoietic Stem Cell Emergence
- Authors
- Sawamiphak, S., Kontarakis, Z., Stainier, D.Y.
- Source
- Full text @ Dev. Cell

Ifng1-2 and Its Receptor Crfb17 Positively Regulate HSC Development (A) Schematic drawing of construct for heat-shock-inducible expression of ifng1-2. The area imaged and analyzed in all experiments (red box) is shown in the embryo illustration. (B and C) Immunofluorescent labeling of V5-tagged Ifng1-2 (blue) in the vicinity of the AGM of control animals lacking the hsp:ifng1-2-V5 transgene (B) compared with Tg(hsp:ifng1-2) animals (C). The AGM region is recognized by Tg(kdrl:HRAS-mCherry) expression (red) in the vasculature. (D and E) Increased number of HSCs at the ventral wall of the dorsal aorta and in the cardinal vein lumen upon ifng1-2 overexpression. HSCs (white arrowheads) in control (D) and Tg(hsp:ifng1-2-V5) (E) embryos were fluorescently labeled by Tg(itga2b:EGFP) (green) and Tg(kdrl:HRAS-mCherry) (red) expression. (F) Number of HSCs per 500 µm aortic length. Values represent means ± SEM, n = 21–22 embryos. p d 0.05. All embryos were heat-shocked at 24 and 48 hpf and imaged at 52–54 hpf. Of note, the numbers of Tg(itga2b:EGFP)+;Tg(kdrl:HRAS-mCherry) (only green) pronephric duct cells appear unaffected by Ifng1-2 overexpression. (G–I) Impaired HSC development in crfb17-/- embryos. Control (crfb17+/+) (G) and crfb17-/- (H) siblings were imaged at 52–54 hpf, and itga2b:EGFP+kdrl:HRAS-mCherry+ HSC (white arrowheads) numbers were analyzed prior to genotyping. (I) HSCs per 500 µm aortic length. Values represent means ± SEM, n = 8–14 embryos, p d 0.01. (J–L) Ifng1-2 knockdown recapitulates the HSC phenotype of crfb17 mutants. itga2b:EGFP+kdrl:HRAS-mCherry+ HSC (white arrowheads) in mock (1% phenol red in nuclease-free distilled water)-injected (J) or ifng1-2 MO-injected (K) embryos imaged at 52–54 hpf. Numbers of HSCs per 500 µm aortic length is shown in (L). Values represent means ± SEM, n = 32–40 embryos, p d 0.001. (M–O) Reduction of runx1 expression upon Ifng1-2 knockdown is restored by ifng1-2 induction. Expression of the HSC marker runx1 in mock-injected (M) and ifng1-2 MO-injected embryos without (N) and with (O) the hsp70:ifng1-2-V5 transgene. (P and Q) ifng1-2 overexpresssion is unable to rescue Crfb17 knockdown. runx1 expression in crfb17 MO-injected embryos without (P) and with (Q) the hsp70:ifng1-2-V5 transgene. All embryos were heat shocked at 24 hpf, and runx1 expression was assessed by in situ hybridization at 36 hpf. The number of embryos showing the representative phenotype per total number of embryos analyzed is indicated in the lower left corner. Red brackets identify the dorsal aorta (DA); blue brackets identify the cardinal vein (CV). All images are lateral views, dorsal up, anterior to the left. |

Cell Proliferation and Survival in the Axial Vessels Do Not Appear to Be Affected by Gain or Loss of Function of Ifng1-2 Signaling (A–C) ifng1-2 overexpression increases HSC number without affecting cell division. HSCs (itga2b:EGFP+kdrl:HRAS-mCherry+, green+red+) that exit the G0 phase, labeled by PCNA immunostaining (blue), in control embryos not harboring the Tg(hsp:ifng1-2-V5) transgene (A), and Tg(hsp:ifng1-2-V5) embryos (B) are indicated by white circles. PCNA HSCs are marked with white arrowheads. (C) Percentage of PCNA+HSCs per total HSCs in the dorsal aorta. Values represent means ± SEM, n = 9 embryos per group, n.s., not significant (p > 0.05). (D–M) Ifng1-2 and Crfb17 knockdown has no effect on apoptosis. Apoptotic cells (green, white arrowheads) visualized by Tg(Tbp:GAL4;UAS:secA5-YFP) expression (D–I) and TUNEL assay (J–M) in the axial vessels of MOCK-injected (D, G, and J), crfb17 MO-injected (E and L), and Ifng1-2 MO-injected (H and K) embryos at 52–54 hpf. Numbers of Tbp:GAL4;UAS:secA5-YFP+ cells (F and I) and TUNEL+kdrl:HRAS-mCherry+ cells per 500 µm dorsal aorta length (M) are shown as means ± SEM, n = 11–25 embryos, n.s. p > 0.05. All images are lateral views, dorsal up and anterior to the left. EXPRESSION / LABELING:
|

Ifng1-2 Signaling Positively Regulates HSC Emergence (A–F) Higher frequency of ECs at the aortic floor that turn on HSC marker expression upon ifng1-2 overexpression. Still images captured at different time points during time-lapse imaging of control (lacking the hsp:ifng1-2-V5 transgene) (A–C) and tg(hsp:ifng1-2-V5) (D–F) embryos starting at 33 hpf, 8 hr after heat shock (see also Movies S1 and S2). White arrowheads point to HSCs, labeled by Tg(itga2b:EGFP) (green) and Tg(kdrl:HRAS-mCherry) (red) expression, just arisen from the aortic wall at each indicated time point. (G–L) Ifng1-2 knockdown reduces the emergence of HSCs and consequently the development of myeloid and lymphoid cells. runx1 expression was assessed during initiation of definitive HSC development at 26 hpf in mock-injected (G) and ifng1-2 MO-injected (H) embryos. Myeloid marker mpx1 expression in 48 hpf mock-injected (I) and ifng1-2 MO-injected (J) embryos. Lymphoid marker rag1 expression in the developing thymus (black circle) of mock-injected (K) and ifng1-2 MO-injected (L) 4 dpf larvae. (M–P) Elevated expression of runx1 upon ifng1-2 overexpression. runx1 expression in 36-38 hpf WT embryos heat-shocked (h.s.) at 10–12 hpf (M) or 20–22 hpf (O) and Tg(hsp:ifng1-2) embryos heat-shocked at 10–12 hpf (N) or 20–22 hpf (P). The number of embryos showing the representative phenotype per total number of embryos analyzed is indicated in the lower left corner. Red brackets identify the dorsal aorta (DA), and blue brackets identify the cardinal vein (CV). All images are lateral views, dorsal up and anterior to the left. |

Ifng1-2 Functions Downstream of Notch Signaling during HSC Development (A–E) Notch inhibition has no additional effect on HSC impairment in crfb17 mutants. HSCs are identified by Tg(itga2b:EGFP) (green) and Tg(kdrl:HRAS-mCherry) (red) expression (white arrowheads) in DMSO-treated (A) or DAPT-treated (B) WT and DMSO-treated (C) or DAPT-treated (D) crfb17/ embryos. Siblings were imaged at 52–54 hpf, and HSC numbers were analyzed prior to genotyping. (E) itga2b:EGFP+kdrl:HRAS-mCherry+ cells per 500 µm aortic length. Values represent means ± SEM, n = 12–13 embryos. (F–I) Reduced efficiency of Notch signaling to induce HSCs in the absence of Ifng1-2. itga2b:EGFP+ cells (green) are observed in the ventral wall of the dorsal aorta of mock-injected control (F) and Tg(hsp:GAL4;UAS:NICD-myc) embryos (G), and ifng1-2 MO-injected Tg(hsp:GAL4;UAS:NICD-myc) embryos (H). Elevated NICD was visualized by Tg(Tp1:H2B-mCherry) expression (red). White arrowheads point to itga2b:EGFP+Tp1:H2B-mCherry+ cells. (I) itga2b:EGFP+Tp1:H2B-mCherry+ cells per 500 µM aortic length. Values represent means ± SEM, n = 8–24 embryos, p d 0.05, p d 0.01, p d 0.001. (J–M) ifng1-2 overexpression rescues the reduction of HSCs caused by Notch inhibition. itga2b:EGFP+ (green) kdrl:HRAS-mCherry+ (red) HSCs (white arrowheads) are imaged in control animals treated with DMSO (J) and DAPT (K) and DAPT-treated Tg(hsp:ifng1-2) animals (L). HSC numbers per 500 µm aortic length are shown as means ± SEM, n = 22–33 embryos, n.s. p > 0.05, p d 0.05, p d 0.01, p d 0.001. All heat-shock treatments were done at 24 and 48 hpf, and all embryos were imaged at 52–54 hpf. (N–Q) Inhibition of Notch signaling downregulates crfb17 and ifng1-2 expression. crfb17 (N and O) and ifng1-2 (P and Q) expression is shown in 36 hpf embryos treated with DMSO (N and P) or DAPT (O and Q) starting at 24 hpf. The number of embryos showing the representative phenotype per total number of embryos analyzed is indicated in the lower left corner. Red brackets identify the dorsal aorta (DA), and blue brackets identify the cardinal vein (CV). All images are lateral views, dorsal up and anterior to the left. |
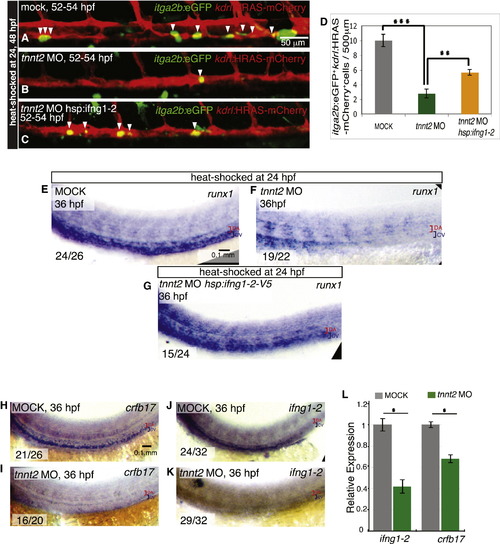
Reduced Ifng1-2 Signaling Is Partially Responsible for the HSC Developmental Defects Caused by the Lack of Blood Flow (A–D) ifng1-2 overexpression partly restores HSCs in embryos with no circulation. itga2b:EGFP+ (green) kdrl:HRAS-mCherry+ (red) HSCs (white arrowheads) are shown in mock-injected controls (A) and tnnt2 MO-injected embryos without (B) and with (C) hsp:ifng1-2 transgene. All embryos were heat shocked at 24 and 48 hpf and imaged at 52–54 hpf. (D) HSC numbers per 500 µm aortic length are shown as means ± SEM, n = 12–20 embryos, p d 0.01, p d 0.001. (E–G) Loss of runx1 expression from the lack of blood flow is rescued by ifng1-2 overexpression. runx1 expression is shown in mock-injected controls (E) and tnnt2 MO-injected embryos without (F) and with (G) the hsp:ifng1-2 transgene. All embryos were heat-shocked at 24 hpf and harvested at 36 hpf. (H–K) crfb17 and ifng1-2 expression depends on blood flow. crfb17 (H and I) and ifng1-2 (J and K) expression is shown in mock-injected (H and J) and tnnt2 MO-injected (I and K) 36 hpf embryos. The number of embryos showing the representative phenotype per total number of embryos analyzed is indicated in the lower left corner. Red brackets identify the dorsal aorta (DA), and blue brackets identify the cardinal vein (CV). All images are lateral views, dorsal up and anterior to the left. qPCR assay of ifng1-2 and crfb17 expression at 36 hpf in tnnt2 MO-injected embryos compared with mock-injected siblings, n = 3, 30 embryos per sample, p d 0.05. (L) qPCR assay of ifng1-2 and crfb17 expression at 36 hpf in tnnt2 MO-injected embryos compared with mock-injected siblings, n = 3, 30 embryos per sample, p d 0.05. |

Crfb17 Signaling Acts Cell Autonomously to Regulate HSC Emergence (A–D) crfb17 overexpression in ECs induces HSC emergence. (A) Schematic drawing of the bidirectional 14xUAS-driven nls-Cerulean and crfb17 expression construct. Tg(cdh5:GAL4FF) embryos were injected with the control construct nls-cerulean:14xUAS (B) or the nls-Cerulean:14xUAS:crfb17 construct (C). nls-Cerulean+ (red) cells that turned on the HSC marker itga2b:EGFP+ (green) are indicated by white asterisks. White arrowheads point to itga2b:EGFPnls-Cerulean+ cells. (D) Percentages of itga2b:EGFP+nls-Cerulean+ per total nls-Cerulean+ cells are shown as means ± SEM, n = 13–16 embryos, p d 0.01. (E–H) Crfb17 is required cell autonomously in the HSC lineage. (E) Schematic drawing of the transplantation assay; 52–54 hpf embryos with transplanted cells from control (crfb17+/+) (F) or crfb17/ (G) embryos carrying the Tg(itga2b:EGFP) (green) and Tg(kdrl:HRAS-mCherry) (red) transgenes. White arrowheads point to green+red+ HSCs. (H) Numbers of itga2b:EGFP+kdrl:HRAS-mCherry+ cells per 100 µm aortic length are shown as means ± SEM, n = 16–20 embryos, p d 0.05. |
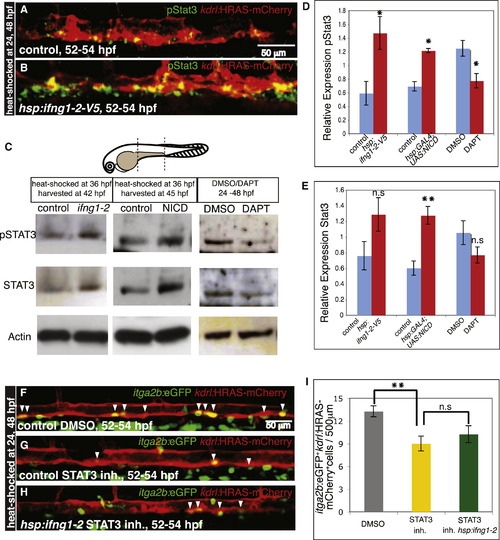
STAT3 Is Activated upon ifng1-2 Induction and Positively Regulates HSC Development (A and B) ifng1-2 overexpression stimulates Stat3 activation in the AGM region. (A) Immunofluorescent staining of phosphorylated Stat3 (pStat3, green) in embryos without (A) and with (B) the hsp:ifng1-2 transgene. All embryos were heat shocked at 24 and 48 hpf and harvested at 52–54 hpf. The AGM region is recognizable by the vascular expression of kdrl:HRAS-mCherry (red). (C–E) Ifng1-2 and Notch signaling regulate Stat3 activation. (C) Western blot analysis of pStat3, total Stat3, and actin expression in the dissected yolk-spanning region of the trunk. Dissected area is outlined by dashed lines in the embryo illustration; 36 hpf embryos were heat shocked for 5 and 8 hr for ifng1-2 and NICD overexpression, respectively. DMSO and DAPT treatments were done from 24–48 hpf. (D) Relative expression of pStat3 normalized to Actin. (E) Relative expression of total Stat3 normalized to Actin. Values represent means ± SEM, n = 3–4 independent experiments, n.s. p > 0.05, p d 0.05, p d 0.01. (F–I) Stat3 inhibition causes a reduction in HSC numbers that cannot be restored by ifng1-2 overexpression. itga2b:EGFP+ (green) kdrl:HRAS-mCherry+ (red) HSCs (white arrowheads) in control embryos (not carrying the hsp:ifng1-2-V5 transgene) treated with DMSO (F) or Stat3 inhibitor (inh) (G) and Tg(hsp:ifng1-2-V5) embryos treated with Stat3 inh (H). All embryos were heat shocked at 24 and 48 hpf and imaged at 52–54 hpf. DMSO and Stat3 inh treatments started at 24 hpf. (I) Numbers of itga2b:EGFP+kdrl:HRAS-mCherry+ cells per 500 µm aortic length are shown as means ± SEM, n = 19–24 embryos, n.s. p > 0.05, p d 0.01. |

Ifn-γ effect on cell proliferation and survival, related to fig. 2. a-c) ifng1-2 overexpression causes a reduction of endothelial cell-cycling rate. kdrl:HRAS-mCherry+ (red) ECs within the dorsal aorta area (dashed lines) that exit the G0 phase in control embryos not harboring the Tg(hsp:ifng1-2-V5) transgene (a) and Tg(hsp:ifng1-2-V5) embryos (b) are labeled with PCNA immunostaining (blue). Increased HSC (Itga2b:EGFP+ cells in green) numbers are apparent in the Tg(hsp:ifng1-2-V5) embryos. All embryos were heat-shocked at 24 and 48 hpf and harvested at 52-54 hpf. c, PCNA+ ECs (blue+red+) per 500 µm dorsal aorta length. Values represent means +/- SEM. n=9 embryos per group. d-f) apoptotic rate of HSCs appears unaffected by Ifn-g deficiency. HSCs (itga2b:EGFP+kdrl:HRAS-mCherry+, green+red+) undergoing apoptosis in mockinjected (d), and ifng1-2 MO-injected (e) embryos were labeled by TUNEL staining (blue), and highlighted in the figure by white circles. TUNEL- HSCs are marked with white arrowheads. f, Percentage of TUNEL+ HSCs per total HSCs at the dorsal aorta. Values represent means +/- SEM. n=9-11 embryos per group. n.s. p>0.05. All images are lateral views, dorsal up and anterior to the left. |
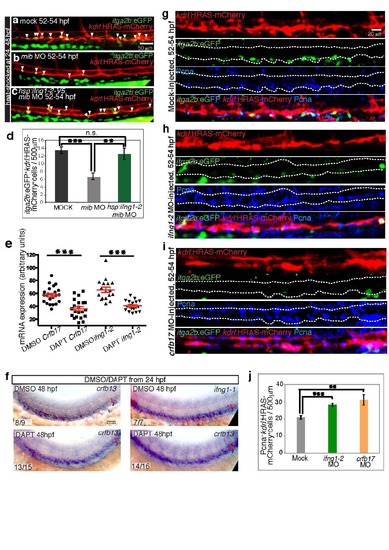
Ifn-γ acts downstream of Notch during HSC emergence, related to fig. 4. a-d) HSC deficiency in mib morphants is rescued by Ifng1-2 overexpression. HSCs in embryos not harboring the Tg(hsp:ifng1-2-V5) transgene, injected with mock (a), mib MO (b) and Tg(hsp:ifng1-2-V5) embryos injected with mib MO (c) are labeled by Tg(itga2b:EGFP) (green) and Tg(kdrl:HRAS-mCherry) (red) expression and marked by white arrowheads. d, HSCs per 500 µm dorsal aorta length. Values represent means +/- SEM. n=18- 33 embryos per group. ** p d 0.01, *** p d 0.001, n.s. not significant. e) Notch inhibition downregulates crfb17 and ifng1-2 expression. crfb17 and ifng1-2 transcripts assessed by in situ hybridization (Fig. 4n-q) were quantified as mean grey values. Red bars show mean+/- SEM. n=21-36 embryos per group. *** p d 0.001. f) Notch signaling inhibition does not appear to affect crfb13 or ifng1-1 expression. crfb13 and ifng1-1 expression in the AGM region of 36-38 hpf embryos treated with DMSO or DAPT starting at 24 hpf. The number of embryos showing the representative phenotype per total number of embryos observed is indicated in the lower left corner. Red brackets identify the dorsal aorta (DA), blue brackets identify the cardinal vein (CV). g-j) Ifn-γ signaling deficiency increases EC cycling rate. kdrl:HRAS-mCherry+ ECs (red) that exit the G0 phase, were marked by PCNA immunostaining (blue), in embryos injected with mock (g), ifng1-2 MO (h) and crfb17 MO (i). Reduction in the number of itga2b:EGFP+ HSCs (green) and, conversely, induction of PCNA+ cells within the dorsal aorta region, indicated by dashed lines, is evident in both ifng1-2 and crfb17 morphants. j. PCNA+ ECs per 500 µm dorsal aorta length. Values represent means +/- SEM. n=9-12 embryos per group. ** p d 0.01, *** p d 0.001. All images are lateral views, dorsal up and anterior to the left. |
Reprinted from Developmental Cell, 31, Sawamiphak, S., Kontarakis, Z., Stainier, D.Y., Interferon Gamma Signaling Positively Regulates Hematopoietic Stem Cell Emergence, 640-653, Copyright (2014) with permission from Elsevier. Full text @ Dev. Cell