
- Title
-
Zebrafish Rab5 Proteins and a role for Rab5ab in nodal signalling
- Authors
- Kenyon, E.J., Campos, I., Bull, J.C., Williams, P.H., Stemple, D.L., Clark, M.D.
- Source
- Full text @ Dev. Biol.

Expression and loss of function of the rab5a family. (A) Expression of rab5aa in the forebrain and midbrain region of a 24 hpf embryo. (B) Forebrain region with dorsal focus showing two patches of bilateral telencephalic cells. (C) Hindbrain region showing expression on the central region of each rhombomere. (D) Expression of rab5aa in cells outside the neural tube at the level of the midbrain/hindbrain boundary (arrow). (E) Expression of rab5aa at the end of the hindbrain (arrows) and in the trunk of the embryo. (F) Side view of a 24 hpf embryo injected with 10 ng of control MO (n=205/207). (G) Side view of a 24 hpf embryo injected with 8 ng of rab5b MO (n=141/143). (H) Side view of a 48 hpf embryo injected with 10 ng of control MO (n=204/204). (I) Side view of a 48 hpf embryo injected with 8 ng of rab5b MO (n=117/126). (J) Side view of a 24 hpf embryo injected with 12 ng of p53 MO (n=77/85). (K) Side view of a 24 hpf embryo co-injected with 12 ng of p53 MO and 8 ng of rab5b MO (n=98/108) (L) Side view of a 48 hpf embryo injected with 12 ng of p53 MO. (M) Side view of a 48 hpf embryo co-injected with 12 ng of p53 MO and 8 ng of rab5b MO (n=52/62). (N) Magnification of trunk region showing somites and notochord in 48 hpf control-injected embryos. (O) Magnification of trunk region showing somites and notochord in 48 hpf rab5b MO-injected embryos. (P) Magnification of trunk region showing somites in a 48 hpf control-injected embryo stained with phalloidin. (Q) Magnification of trunk region showing somites in a 48 hpf rab5b MO-injected embryo stained with phalloidin. (R) Magnification of trunk region showing somites and notochord in 48 hpf p53 MO injected embryos. (S) Magnification of trunk region showing somites and notochord in 48 hpf p53 MO and rab5b MO co-injected embryos. (T) Magnification of trunk region showing somites in a 48 hpf p53 MO injected embryo stained with phalloidin. (U) Magnification of trunk region showing somites in a 48 hpf p53 MO and rab5b MO co-injected embryo stained with phalloidin. (V) Lateral view of a 30 hpf embryo injected with 5 ng of control MO (n=92/95). (W) Lateral view of a 30 hpf embryo injected with 6 ng of rab5c MO (n=174/175). (X) Lateral view of a 48 hpf embryo injected with 5 ng of control MO (n=92/95). (Y) Lateral view of a 48 hpf embryo injected with 6 ng rab5c MO (n=158/159). (Z) Lateral view of a 30 hpf embryo injected with 9 ng of p53 MO (n=54/54). (AA) Lateral view of a 30 hpf embryo co-injected with 9 ng of p53 MO and 6 ng of rab5c MO (n=n=54/56). (AB) Lateral view of a 48 hpf embryo injected with 9 ng of p53 MO. (AC) Lateral view of a 48 hpf co-injected with 9 ng of p53 MO and 6 ng of rab5c MO (n=37/48). (AD) Magnification of trunk region showing somites and notochord in 48 hpf control-injected embryos. (AE) Magnification of trunk region showing somites and notochord in 48 hpf rab5c MO-injected embryos. (AF) Magnification of trunk region showing somites in a 48 hpf control-injected embryo stained with phalloidin. (AG) Magnification of trunk region showing somites in a 48 hpf rab5c MO-injected embryo stained with phalloidin. (AH) Magnification of trunk region showing somites and notochord in 48 hpf p53 MO injected embryos. (AI) Magnification of trunk region showing somites and notochord in 48 hpf p53 MO and rab5c MO co-injected embryos. (AJ) Magnification of trunk region showing somites in a 48 hpf p53 MO injected embryo stained with phalloidin. (AK) Magnification of trunk region showing somites in a 48 hpf p53 MO and rab5c MO co-injected embryo stained with phalloidin. (A, B, D, E are dorsal views, anterior to the left and the eyes were manually removed for simplification C is a side view, anterior to the left (‘ov’ indicates otic vesicle). |
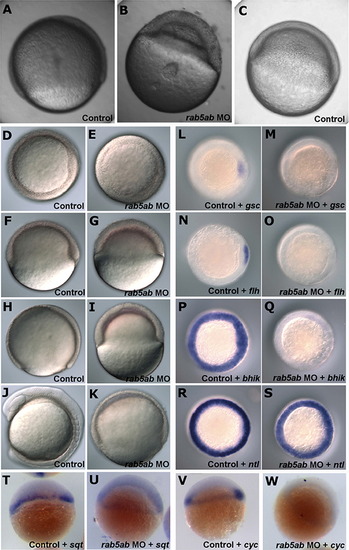
Loss of function of rab5ab. (A) Control embryo at 70% epiboly compared to (B) a 5 ng rab5ab MO-injected embryo at the same time point showing apparent accumulation of extracellular fluid between the yolk and the cells. (C) Control embryo at shield stage. (D) Animal view and (F) side view of a control-injected embryo at shield stage compared to (E) animal view and (G) side view of 3 ng rab5ab MO-injected embryos at the same time point. (H) Control-injected embryos at 90% epiboly compared to (I) the same time point in the 3 ng rab5ab MO-injected embryos. (J) 8 somite stage control embryo compared to (K) 3 ng rab5ab MO-injected embryo at the same time point. Expression pattern of gsc in (L) control MO-injected embryos (n=40/40) compared to (M) 3 ng rab5ab MO-injected embryos (n=41/41). Expression pattern of flh in (N) control MO-injected embryos (n=20/20) compared to (O) 3 ng rab5ab MO-injected embryos (n=21/21). Expression pattern of bhik in (P) control MO-injected embryos (n=29/29) compared to (Q) 3 ng rab5ab MO-injected embryos n=31/31). Expression pattern of ntl in (R) control MO-injected embryos (n=40/40) compared to (S) 3 ng rab5ab MO-injected embryos (n=39/39). Lateral view of expression pattern of ndr1 in (T) control MO-injected embryos (n=30/30) compared to (U) rab5ab MO-injected embryos (n=30/30). Lateral view of expression pattern of ndr2 in (V) control MO-injected embryos (n=30/30) compared to (W) rab5ab MO-injected embryos (n=29/29). EXPRESSION / LABELING:
PHENOTYPE:
|

A role for rab5ab in Nodal signalling. Lateral view of (A) shield stage control injected embryo compared to (B) shield stage 1.5 ng rab5ab mRNA overexpressing embryo (n=14/41). Lateral view of (C) 24 hpf control injected embryo compared to (D) 24 hpf 1.5 ng rab5ab mRNA overexpressing embryo (n=12/39). Lateral view of (E) 5dpf control injected embryo compared to (F) 5dpf 1.5 ng rab5ab mRNA overexpressing embryo (n=38/38). Expression of gsc in control embryos at (G) 30%, (I) 50%, (K) 70% and (M) 90% epiboly compared to expression of gsc in rab5ab overexpressing embryos at (H) 30% (n=10/12), (J) 50% (n=20/21), (L) 70% (n=8/13) and (N) 90% epiboly (n=5/10). Expression of ntl in control embryos at (O) 30%, (Q) 50%, (S) 70% and (U) 90% epiboly compared to expression of ntl in rab5ab overexpressing embryos at (P) 30% (n=8/12), (R) 50% (n=21/22), (T) 70% (n=9/13) and (V) 90% epiboly (n=7/10). Expression of chd in control embryos at (W) 30%, (Y) 50%, (AA) 70% and (AC) 90% epiboly compared to expression of ntl in rab5ab overexpressing embryos at (X) 30% (n=12/12), (Z) 50% (n=11/11), (AB) 70% (n=10/10) and (AD) 90% epiboly (n=10/10). The gsc expression patterns are shown as animal pole views as are 30% epiboly ntl expressing embryos and 30% and 50% chd expressing embryos. The remainder of the embryos are shown as a side view for improved visualisation of expression patterns. EXPRESSION / LABELING:
|
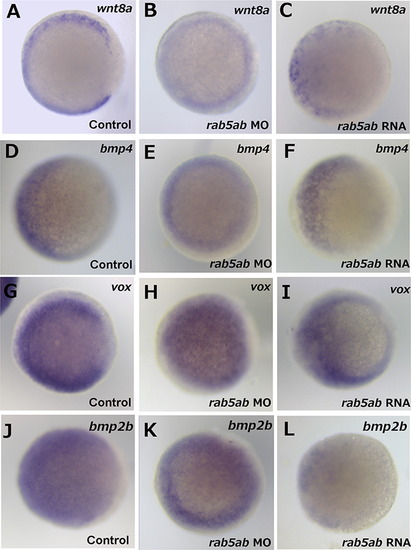
The role of rab5ab in ventral gene expression. Expression of wnt8a in (A) control injected embryos (n=27/27), (B) rab5ab MO injected embryos (n=29/29) and (C) rab5ab RNA injected embryos (n=41/42) at 30% epiboly. Expression of bmp4 in (D) control injected embryos (n=17/17), (E) rab5ab MO injected embryos (n=27/27) and (F) rab5ab RNA injected embryos (n=20/20) at 30% epiboly. Expression of vox in (G) control injected embryos (n=47/47), (H) rab5ab MO injected embryos (n=32/32) and (I) rab5ab RNA injected embryos (n=55/55) at 30% epiboly. Expression of bmp2b in (J) control injected embryos (n=41/41), (K) rab5ab MO injected embryos (n=36/36) and (L) rab5ab RNA injected embryos (n=41/41) at 30% epiboly. All embryos shown are animal view. EXPRESSION / LABELING:
|
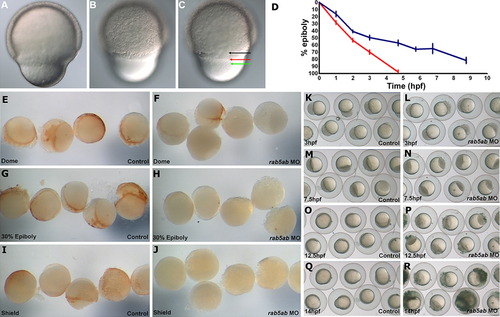
Roles for rab5ab in endocytosis and epiboly. (A), (B) and (C) Lateral views, (dorsal to the right) of epiboly of cells of the blastoderm (black arrow), enveloping layer (red arrow) and yolk syncytial layer (green arrow) in a 70% epiboly stage 3 ng rab5ab MO injected embryo in three different focal planes. (D) Graph shows the progression of epiboly in rab5ab MO-injected embryos (blue line) and in control embryos (red line) (n=12). Animal view of control embryos at (E) dome (G) 30% epiboly and (I) shield stage compared to (F) dome (n=13/17), (H) 30% epiboly (n=12/13) and (J) shield stage (n=14/15) in 5 ng rab5ab MO injected embryos. The brown staining shows the uptake of biotin via endocytosis during epiboly. Control embryos (n=16/16) subjected to cold shock at (K) 3 hpf, (M) 7.5 hpf, (O) 12.5 hpf and (Q) 14 hpf when compared to rab5ab MO-injected embryos (n=14/14) subjected to cold shock at (L) 3 hpf, (N) 7.5 hpf, (P) 12.5 hpf and (R) 14 hpf. |
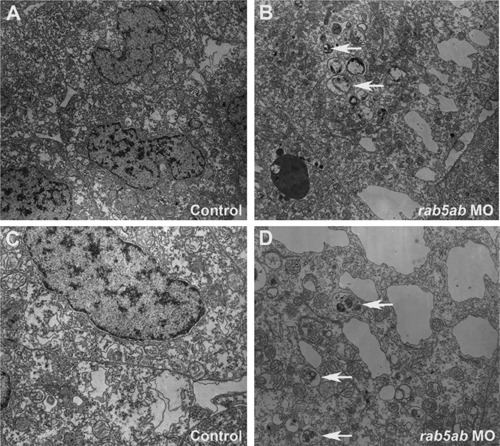
Activity of rab5ab in endocytosis. Transverse sections of cells of the leading edge of the enveloping layer from a 3 ng control-injected embryo 80% epiboly (A) and (C), a 3 ng rab5ab MO injected embryo (fixed at 40% epiboly but when control embryos were at 80% (B) and (D). White arrows show large secondary lysosomes with membranous contents. (A) and (B) are at 10,000×; and (C) and (D) are at 18,750×. PHENOTYPE:
|
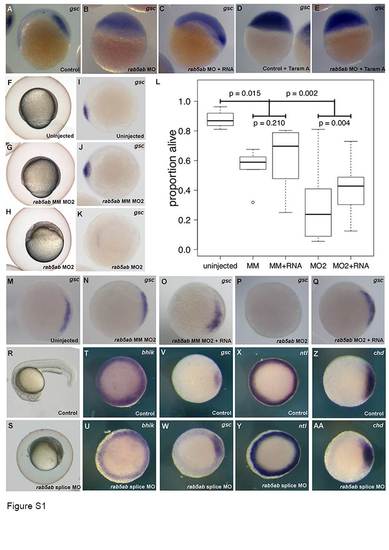
Rescue of rab5ab MO′s and phenotype of rab5ab splice MO. Lateral view of gsc expression in (A) control MO-injected embryos (n=30/30) compared to (B) rab5ab MO-injected embryos (n=30/30) and (C) rab5ab MO and rab5ab RNA injected embryos (n=30/31). Lateral view of gsc expression in (D) control and Taram-A RNA injected embryos (n=20/20) and (E) rab5ab morpholino and Taram-A RNA-injected embryos (n=20/20). Lateral view of (F) control uninjected embryos (n=62) (G) rab5ab mismatch MO2-injected embryos (n=119/119) and (H) rab5ab MO2 injected embryos when compared at the same time point (n=102/103). Animal view of gsc expression in 50% epiboly stage (I) control uninjected embryos (n=10/10) compared to (J) rab5ab mismatch (MM) MO2-injected embryos (n=10/10) and (K) rab5ab MO2 injected embryos (n=10/11). (L) Box-whisker plots show empirical distributions of uninjected, rab5ab MM MO2 injected, rab5ab MM MO2+RNA injected, rab5ab MO2 and rab5ab MO2+RNA injected embryos that survive to 30% epiboly. Horizontal lines denote median expression and boxes cover the interquartile range. Whiskers extend to 1.5 times the interquartile range, with additional outliers plotted as points. Animal view of gsc expression in 50% epiboly stage (M) control uninjected embryos (n=31/31) compared to (N) rab5ab MM MO2 injected embryos (n=51/51), (O) rab5ab MM MO2+RNA injected embryos, (P) rab5ab MO2 injected embryos (n=20/33) and (Q) rab5ab MO2+RNA injected embryos (n=36/42). Side view of (R) 24 hpf control embryo (n=30), side view of (S) embryos injected with 10 ng of rab5ab splice MO (n=30). Animal view of expression pattern of bhik in control (T) and rab5ab splice (U) morpholino injected embryos. Animal view of expression pattern of gsc in control (V) and rab5ab splice (W) morpholino injected embryos. Animal view of expression pattern of ntl in control (X) and rab5ab splice (Y) morpholino injected embryos. Animal view of expression pattern of chd in control (Z) and rab5ab splice (AA) morpholino injected embryos (n=10/12). |
Reprinted from Developmental Biology, 397(2), Kenyon, E.J., Campos, I., Bull, J.C., Williams, P.H., Stemple, D.L., Clark, M.D., Zebrafish Rab5 Proteins and a role for Rab5ab in nodal signalling, 212-24, Copyright (2015) with permission from Elsevier. Full text @ Dev. Biol.