
- Title
-
Non-muscle myosin IIA and IIB differentially regulate cell shape changes during zebrafish brain morphogenesis
- Authors
- Gutzman, J.H., Sahu, S.U., Kwas, C.
- Source
- Full text @ Dev. Biol.

myh9a, myh9b, and myh10 are expressed during the time of MHB morphogenesis. (A) Diagram of the zebrafish myh9a, myh9b, and myh10 genes. Domain regions are highlighted. Regions amplified for RT-PCR time course expression are shown with arrows (primer details can be found in “Materials and Methods”). Asterisks indicate the regions of the full length myh9a and myh9b in the current Ensembl zebrafish genome that have not been completely annotated. (B) RT-PCR analysis of myh9a, myh9b, and myh10 over a time course of embryonic development spanning MHB morphogenesis. EF1α was used as a control. Primer locations are indicated in panel A. (C) Time course of gene expression by in situ hybridization for myh9a, myh9b, and myh10 in the developing embryo from 4 hpf–24 hpf. Each gene is shown with the antisense probe expression pattern and sense control. |

myh9b, myh10, and mypt1 are required for MHB tissue morphogenesis (A-D) Brightfield dorsal view images of 24 ss embryos following injection with (A) control MO, (B) myh9a MO, (C) myh9b MO, (D) myh10 MO. Anterior is to the left in all images. Arrowheads indicate MHBC. Scale bars: 100 µm. (E-I) Live confocal images showing the MHB region of 24 ss zebrafish embryos injected with mGFP mRNA and coinjected with control MO (E), myh9a MO (F), myh9b MO (G), myh10 MO (H), or mypt1 MO (I). (J) Quantification of the MHB angle on the basal side of the neuroepithelium (see angle lines in E-I). One-way ANOVA with multiple t-test comparisons was performed to determine significance between control and test groups. Asterisks indicate p<0.001. Results are shown as±s.e.m. For E-I; control MO, n=48; myh9a MO, n=10; myh9b MO, n=16; myh10 MO, n=18; mypt1 MO, n=20. PHENOTYPE:
|
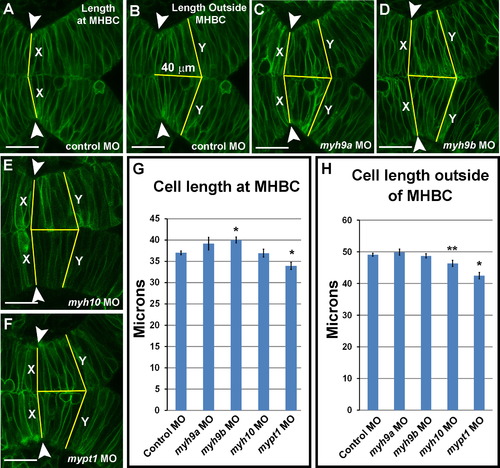
myh9b is required for cell shortening at the MHBC during morphogenesis. (A-F) Live confocal images showing the MHB region of 24 ss zebrafish embryos injected with mGFP and coinjected with control MO (A-B), myh9a MO (C), myh9b MO (D), myh10 MO (E), or mypt1 MO (F). (G) Quantification of the cell length (X) at the MHBC (see lines in A, C-F). (H) Quantification of cell length 40 µm outside of the MHBC (Y) (see lines in B-F). One-way ANOVA with multiple t-test comparisons was performed to determine significance between control and test groups. Asterisks indicate p<0.001. Double asterisks indicate p<0.05. Results are shown as±s.e.m. Control MO, n=48; myh9a MO, n=10; myh9b MO, n=16; myh10 MO, n=18; mypt1 MO, n=20. Scale bars: 25 µm. PHENOTYPE:
|

myh10 is required for regulation of cell width in the MHB during morphogenesis. (A-E) Live confocal images showing one side of the MHB region of 24 ss zebrafish embryos injected with mGFP and coinjected with control MO (A), myh9a MO (B), myh9b MO (C), myh10 MO (D), or mypt1 MO (E). Single representative cells are outlined in each panel. (F) Quantification of cell width. (G) Quantification of cell area. One-way ANOVA with multiple t-test comparisons was performed to determine significance between control and test groups. Asterisks indicate p<0.001. Double asterisks indicate p<0.05. Results are shown as±s.e.m. 6 cells per embryo (n) were outlined: 2 cells at the MHBC, 2 cells 40 µm posterior to the MHBC, and 2 cells within the 40 µm region between the MHBC and posterior. Cells were chosen based on the ability to see an entire cell from apical to basal in a single z-section. Control MO, n=9; myh9a MO, n=9; myh9b MO, n=14; myh10 MO, n=9; mypt1 MO, n=9. Scale bars: 25 µm. PHENOTYPE:
|

Actin distribution is dependent upon non-muscle myosin II function. (A-F) Embryos were injected as indicated and stained with phalloidin (green) to determine actin localization and regional enrichment. (A-C) Control morphant embryos with normal actin distribution at the MHB. Boxes indicate areas of comparison for determining the mean actin intensity ratio. (A) Comparison of actin intensity with the neuroepithelium at the MHBC region (box 1) compared to the posterior MHB (box 2). (B) Comparison of actin intensity apically at the midline (box 1) compared to the apical region within the neuroepithelial tissue (box 2). (C) Comparison of actin intensity on the basal side of the neuroepithelium (box 1) compared to the basal region within the neuroepithelial tissue (box 2). (G) Quantification of actin distribution comparison ratios for control MO, myh9b MO, myh10 MO, and mypt1 MO injected embryos in the regions indicated. One-way ANOVA with multiple t-test comparisons was performed to determine significance between control and test groups. Results are shown as±s.e.m. Asterisks indicate significance compared to control, p<0.001. Double asterisks indicate, p<0.01. Arrowheads indicate MHBC. Control MO, n=8; myh9b MO, n=12; myh10 MO, n=13; mypt1 MO, n=8. PHENOTYPE:
|

Non-muscle myosin IIA and IIB protein localization. (A-C) NMIIA and NMIIB antibody staining in 24 ss embryos injected with control MO. (A) NMIIA antibody (green), (B) NMIIB antibody (red), (C) overlay of A and B. (D) Overlay of NMIIA and NMIIB immunostaining in a 24 ss mypt1 MO injected embryo. (E) NMIIA staining with myh10 MO knockdown. (F) NMIIB staining with myh9b MO knockdown. (G-H) No primary control from Alexa 488 and Alexa 555 secondary antibodies. Results are representative of at least three independent experiments. Control MO, n=8; mypt1 MO, n=7; myh10 MO, n=14; myh9b MO, n=19; Alexa 488 no primary control, n=5; Alexa 555 no primary control, n=5. EXPRESSION / LABELING:
|

Whole embryo phenotypes for morpholino injected embryos. Single cell embryos were injected with (A,B) 4ng control MO + 4ng p53 MO, (C,D) 4ng myh9a MO, (E,F) 3ng myh9b MO + 3ng p53 MO, or (G,H) 3ng myh10 MO. Live embryos were imaged using brightfield microscopy at 24 ss and at 48 hpf as indicated. myh9a morphants did not demonstrate any obvious phenotypes at the times imaged. For myh9b and myh10 morphants, representative mild phenotypes are shown. myh9b morphants demonstrated somite defects, abnormal tail curvature, pigmentation defects, heart abnormalities, slight edema, and abnormal eye and ear formation. myh10 morphants had abnormal body axis curvature, heart abnormalities, slight edema, and abnormal eye development. PHENOTYPE:
|
Reprinted from Developmental Biology, 397(1), Gutzman, J.H., Sahu, S.U., Kwas, C., Non-muscle myosin IIA and IIB differentially regulate cell shape changes during zebrafish brain morphogenesis, 103-15, Copyright (2015) with permission from Elsevier. Full text @ Dev. Biol.