
- Title
-
Genome-wide RNA Tomography in the Zebrafish Embryo
- Authors
- Junker, J.P., Noël, E.S., Guryev, V., Peterson, K.A., Shah, G., Huisken, J., McMahon, A.P., Berezikov, E., Bakkers, J., van Oudenaarden, A.
- Source
- Full text @ Cell

Tomo-Seq Determines Gene Expression Patterns with High Spatial Resolution (A) Expression trace for egr2b in tail-to-head sample. (B) Tomo-seq data for posterior end of an 18 somites stage embryo sequenced at higher depth. (i) Expression patterns of mespab and mespaa are very similar, with the exception of a shoulder on the posterior side of the main peak for mespaa. (ii) mRNA in situ hybridization confirms these differential expression domains (view of the tail, posterior to the right). See also Figure S2 and Table S2. (C) Tomo-seq traces for selected genes along the posterior-to-anterior axis of E10.5 mouse forelimbs (right forelimbs of four wild-type and four Gli3/ littermates). Forelimbs were sectioned as shown in the inset in the top left panel in order to resolve gradients of hedgehog target genes and pathway components. Tomo-seq traces and expression changes in Gli3/ limbs are in full agreement with published whole-mount in situ data (Litingtung et al., 2002). EXPRESSION / LABELING:
|
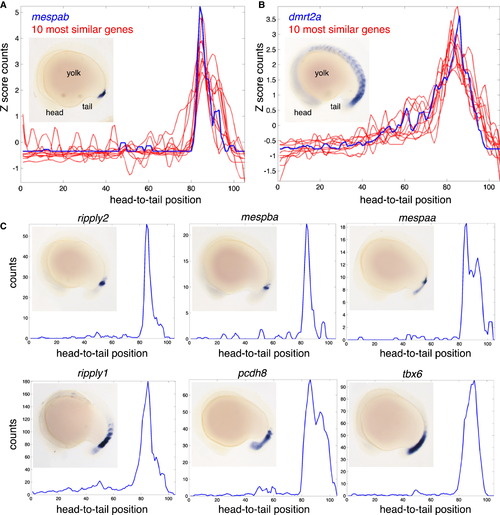
Genome-wide Determination of Genes with Similar Expression Patterns (A) Tomo-seq expression patterns for mespab and 10 most similar genes as determined by Euclidean distance of Z score transformed expression traces (summed over head-to-tail and tail-to-head samples). Inset shows mRNA whole mount in situ hybridization expression pattern of mespab. (B) Tomo-seq expression patterns for dmrt2a and ten most similar genes. Inset shows mRNA whole mount in situ hybridization expression pattern of dmrt2a. (C) Tomo-seq expression traces and whole-mount in situ hybridization images for six genes that are similar to mespab. All in situ hybridizations are lateral views, anterior to left. See also Figure S3. EXPRESSION / LABELING:
|
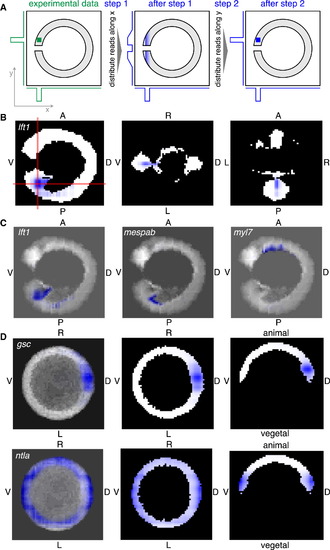
RNA Tomography Allows Construction of a Spatially Resolved Transcriptome-wide Atlas of Gene Expression in 3D (A) Mathematical approach for 3D image reconstruction based on 1D projections. The expression pattern of a hypothetical gene is shown as a green square in the left panel. The middle and right panel show reconstructed expression patterns after sequential optimization steps in blue. Measured 1D tomo-seq traces are depicted as green lines, projections of computationally reconstructed image on x and y axis are shown as blue lines to the left of and under the panels. The steps shown here were iterated 100 times for optimal image reconstruction. (B–D) Normalized expression patterns of selected genes (blue) after 3D image reconstruction. The shape of the embryos is shown in black and white. (B) Left: expression of lft1 at 15 somites stage in a plane perpendicular to LR axis through the middle of the embryo. Middle and right: lft1 expression in the two planes indicated by red lines in the left panel. (C) Projection images (summed over LR axis) for lft1, mespab, and myl7 expression patterns at 15 somites stage. (D) Left: projection along animal-vegetal axis for gsc and ntla at shield stage. Middle: expression in a plane perpendicular to animal-vegetal axis at the level of the margin. Right: expression in a plane perpendicular to LR axis through the middle of the embryo. See also Figure S6 and Data S2. EXPRESSION / LABELING:
|
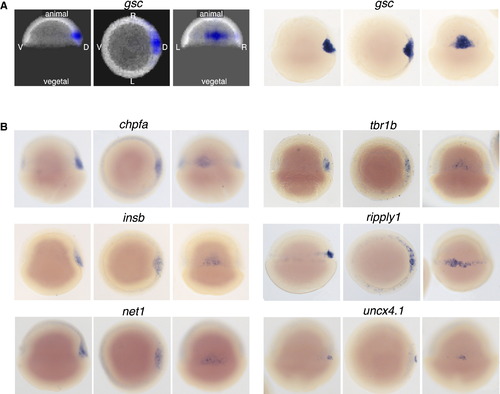
Determining Genes with Similar Expression Patterns in 3D (A) RNA tomography data and in situ validation for gsc. Images show projections of reconstructed expression patterns along different body axes of shield stage embryos and microscopy images taken in the corresponding orientations. Left: lateral view, visualized from left. Middle: animal pole view. Right: dorsal view. (B) Validation of novel genes with inferred expression patterns similar to gsc at shield stage. Panels show microscopy images along different body axes of shield stage embryos. See also Figure S7 and Movies S1 and S2. |
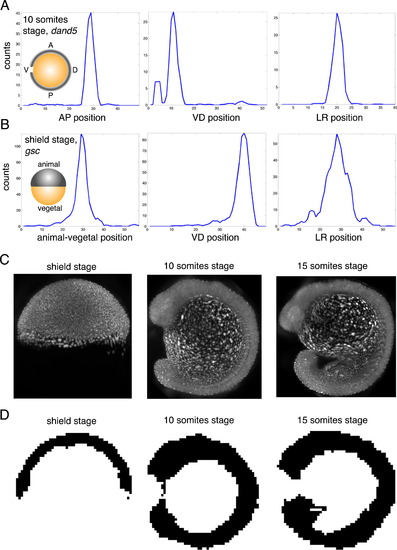
Selective Plane Illumination Microscopy Allows Measuring the Shape of Embryos in 3D, Related to >Figure 5 (A) Expression patterns for dand5 at 10 somites stage along AP, VD and LR axis. (B) Expression patterns for gsc at shield stage along animal-vegetal, VD and LR axis. (C) SPIM data for Tg(h2afva:h2afva-mCherry) zebrafish embryos at shield stage, 10 somites stage, and 15 somites stage. Images show projections along LR axis. (D) 3D mask of zebrafish embryo at 3 stages (binary images created by aligning SPIM data for 3 different embryos). Images show single plane perpendicular to LR axis through the middle of the embryo. |

Approach for 3D Image Reconstruction Based on Tomo-Seq Data along the Three Main Body Axes, Related to Figure 6 (A) Projection images along LR axis for dand5, egr2b and cdx4 expression patterns at 10 somites stage. (B) Left: Projection along animal-vegetal axis for bmp4 at shield stage. Middle: Expression in a plane perpendicular to animal-vegetal axis at the level of the margin. Right: Expression in a plane perpendicular to LR axis through the middle of the embryo. (C) The 1D projections shown in green in the left panel can potentially give rise to artifacts: The red pattern (middle) and the blue pattern (right) lead to the same 1D projections and can hence not be easily distinguished. However, we can rule out the red pattern by taking into account the shape of the embryo measured in Figures S5C and S5D – the red squares lie outside the embryo and are hence not valid solutions. |
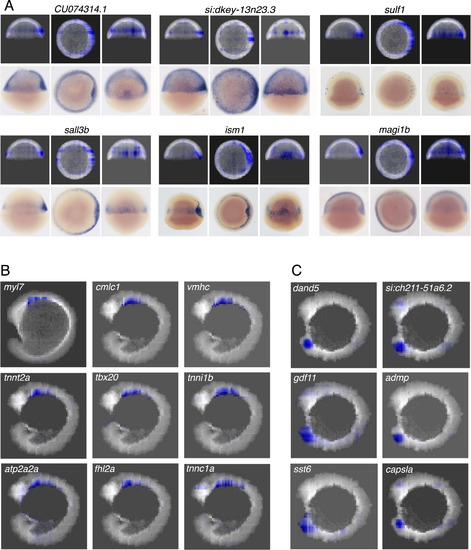
Identifying Genes Expressed in the Heart and Kupffer’s Vesicle, Related to Figure 7 (A) Additional novel genes with inferred expression patterns similar to gsc at shield stage, and validation by in situ hybridization. (B) Projection images along LR axis for the 8 genes with expression patterns most similar to myl7 at 15 somites stage. All genes have a known role in heart development. (C) Projections along LR axis for selected genes with expression patterns similar to dand5 at 10 somites stage. capsla, admp and gdf11 have been shown to be expressed in the Kupffer’s vesicle or, more broadly, in the tip of tail. Expression patterns for si:ch211-51a6.2 and sst6 are novel. EXPRESSION / LABELING:
|
Reprinted from Cell, 159, Junker, J.P., Noël, E.S., Guryev, V., Peterson, K.A., Shah, G., Huisken, J., McMahon, A.P., Berezikov, E., Bakkers, J., van Oudenaarden, A., Genome-wide RNA Tomography in the Zebrafish Embryo, 662-75, Copyright (2014) with permission from Elsevier. Full text @ Cell