
- Title
-
S1P-Yap1 Signaling Regulates Endoderm Formation Required for Cardiac Precursor Cell Migration in Zebrafish
- Authors
- Fukui, H., Terai, K., Nakajima, H., Chiba, A., Fukuhara, S., Mochizuki, N.
- Source
- Full text @ Dev. Cell

Yap1/Tead-Dependent Transcription Is Required for Cardiac Precursor Cell Migration toward Midline (A) 3D-rendered confocal stack merged images (bright field and fluorescence) of Tg(myosin light polypeptide 7 [myl7]:nuclear localization signal-tagged tandem EosFP [Nls-tdEosFP]) embryos (48 hr postfertilization [hpf]) uninjected (left) and injected with morpholino (MO) indicated (center and right). tdEosFP fluorescence is shown as green. Images displayed in the following figures are the 3D-rendered images of a stack. Images are ventral views unless otherwise described (anterior to the top). The confocal images and WISH images in the following figures are a set of representative images of at least four independent experiments. (B) WISH analyses of the embryos (24 hpf) of the wild-type (left) and those injected with the MO indicated (center and right) using antisense probe for myl7. A set of representative images of four independent experiments is shown. (C) A schematic illustration of zebrafish (z) Yap1 and EGFP-zYtip. The numbers, amino acids (aa); EGFP-zYtip, EGFP fused with a Tead binding domain (aa 7-103 of zYap1). (D) Luciferase activity of the 293T cells transfected with the plasmids coding upstream activation sequence (UAS) followed by luciferase cDNA together with the plasmids indicated at the bottom. zYap1 binding to human TEAD2 fused with a DNA-binding domain of GAL4 (GAL4 db-hTEAD2) could promote UAS-dependent transcription of luciferase. The graph shows the average with SEM of the relative luciferase unit normalized by the luciferase activity of untransfected cells (n = 6). (E) Images of Tg(myl7:Nls-mCherry) embryos at 48 hpf uninjected (left) and injected with mRNAs indicated at one-cell stage with 50 pg (center) and 200 pg (right) EGFP-zytip mRNA. mCherry image (pseudocolor magenta), EGFP image, and bright field image are merged. (F) Quantitative analyses of the incidence of cardia bifida of (E). The graph shows the percentage calculated by the number of the embryos exhibiting cardia bifida among the embryos injected with mRNAs indicated at the bottom. Total number of the embryos injected with mRNA is indicated on the top of column. Hereafter, total number of the embryos investigated is indicated on the top of the column. §p < 0.0001. See also Figure S1. |

Yap1 Functions Downstream of S1P-S1pr2 Signaling in the Endoderm (A) Confocal images of Tg(myl7:Nls-tdEosFP) embryos at 48 hpf injected with MO indicated at the bottom into the yolk syncytial layer (YSL). (B) Quantitative analyses of the incidence of cardia bifida of (A). Graph shows the percentage of the embryos with cardia bifida among the total embryos injected with MO indicated at the bottom. (C) The incidence of cardia bifida of Tg(myl7:Nls-tdEosFP) embryos injected with MO and the plasmids (30 pg/embryo) transiently expressing either EGFP (G) or EGFP-tagged Lats1/2 kinase-insensitive Yap1 (Y) under the control of sox17 promoter using Tol2 transposon system. (D) WISH analyses of foxa2 expression of the embryos (26 hpf) uninjected (left) and injected with MO indicated at the bottom (center and right). Note that foxa2 mRNA was detected in the endoderm and in the notochord and that the space between bilateral pharyngeal endoderm was widened in the yap1 morphants and s1pr2 morphants. A set of representative images of four independent experiments is shown as dorsal views. (E) 3D-rendered two-photon laser-scanned z-stack images of Tg(sox17:GFP);(myl7:Nls-mCherry) embryos uninjected (left) and injected with MO indicated at the bottom. gna13 MO stands for both gna13a and gna13b MOs. Asterisks indicate the defect of the endoderm. (F and G) Quantitative analyses of incidence of the defects in the endoderm with cardia bifida in the embryos treated with the MOs indicated at the bottom. (H and I) Images of those injected with the plasmid indicated at the top (25 pg/embryo) into the embryo indicated at the top. Note that forced expression of zYtip in the endoderm resulted in the defect of the endoderm with cardia bifida while that in the CPCs did not. Asterisk indicates the endodermal defect. (J) Quantitative analyses of the results obtained in (H) and (I). §p < 0.0001, †p < 0.01, ‡p < 0.05. See also Figure S2. EXPRESSION / LABELING:
PHENOTYPE:
|

Yap1 Regulates Endodermal Cell Survival (A) Time-sequential (from eight-somite stage [8s] to 16-somite stage [16s]) images of Tg(sox17:GFP) embryos injected with MO indicated at the left. Arrows denote the fragmentation of sox17 promoter-driven GFP-positive cells. A set of representative images of eight independent experiments is shown. Dorsal view. (B) Incidence of cardia bifia (black) and normal heart (white) in the morphants exhibiting less than 5 fragmented endodermal cells or more than 5 fragmented endodermal cells in the embryos treated with the MO indicated at the bottom. (C) Bar graph shows the number of the TUNEL-positive cells among the GFP-positive endodermal cells of Tg(sox17:GFP) embryos at 14-somite stage (14s) injected with MO indicated at the bottom. ctrl MO, control morpholino. †p < 0.01 (versus ctrl morphants). (D) Bar graph shows the number of the TUNEL-positive cells in a S1pr2 mutant (mil), heterozygous embryo (s1pr2m93/+) and homozygous embryos (s1pr2m93/m93). †p < 0.01. (E) Gene expression profile analyzed by RNA-seq using RNAs obtained from the Tg(sox17:GFP) embryos uninjected (control) and injected with yap1 MO by sorting of GFP-positive endodermal cells. The graph shows the ratio of the reads per kilobase per million reads (RPKM) of the yap1 morphants-derived RNAs divided by that of the control. Among the genes we analyzed, those regulating cell survival are listed. See also Figure S3 and Movies S1, S2, and S3. EXPRESSION / LABELING:
PHENOTYPE:
|
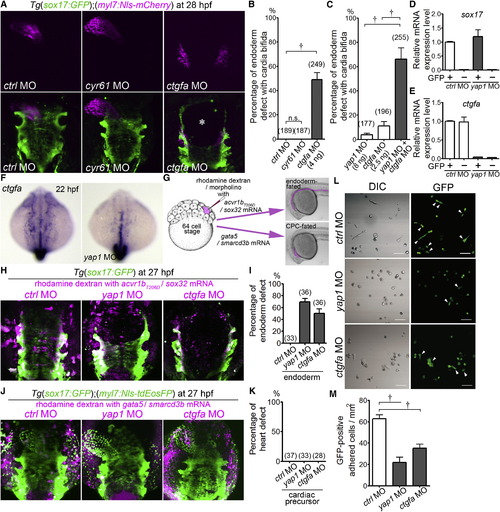
Endodermal Cells Cell-Autonomously Regulate Their Survival in a Manner Dependent on the Expression of Yap1-Promoted ctgfa (A) 3D-rendered two-photon laser-scanned z-stack images of Tg(sox17:GFP);(myl7:Nls-mCherry) embryos (28 hpf) injected with MO indicated at the bottom. An asterisk shows the defect of the endoderm. Dorsal view. (B and C) Incidence of endoderm defects with cardia bifida of Tg(sox17:GFP);(myl7:Nls-mCherry) embryos injected with MO indicated at the bottom. Total number of the embryos analyzed in each morphant group is indicated at the top of the column. (D and E) Quantitative-PCR analyses of expression of sox17 mRNA (D) and ctgfa mRNA (E) in the endoderm (GFP+ cells) and extra-endoderm (GFP- cells) of the Tg(sox17:GFP) embryos injected with MO indicated at the bottom. GFP+ and GFP- cells from the embryo at 12 hpf were sorted by GFP fluorescence (n = 4). (F) WISH analyses of ctgfa mRNA expression in the wild-type embryo (left) and in the yap1 morphant (right; 22 hpf). A set of representative images of four independent experiments is shown. Dorsal view. (G) Schematic illustration of injection of MO into the endoderm-fated cells (simultaneous injection of both acvr1bT206D and sox32 mRNAs) and into the CPC-fated cells (simultaneous injection of both gata5 and smarcd3b mRNAs) with rhodamine dextran to visualize the cells injected with MO and mRNAs. MO, mRNA, and rhodamine dextran were coinjected into one blastomere at the 64-cell stage. (H) Representative 3D-rendered confocal images of the Tg(sox17:GFP) embryo injected with mRNAs indicated at the top with the MOs indicated above the image as explained in (G). (I) Quantitative analyses of incidence of endodermal defects in the embryos examined in (H). (J) Representative 3D-rendered confocal images of the Tg(sox17:GFP);(myl7:Nls-tdEosFP) embryo injected with mRNAs indicated at the top with the MOs indicated above the image as explained in (G). (K) Quantitative analyses of incidence of heart defects in the embryos examined in (J). (L and M) Attachment and spread of the endodermal cells obtained at 12 hpf from Tg(sox17:GFP) embryos injected with MO indicated at the top to the fibronectin-coated dish. Arrowheads indicate the cells spreading after attachment to the dish. A panel of representative result of three independent experiments is shown in (L). Scale bars represent 50 µm. (M) The graph shows the number of the spreading GFP-positive cells after attachment. †p < 0.01. See also Figure S4. EXPRESSION / LABELING:
PHENOTYPE:
|
Reprinted from Developmental Cell, 31, Fukui, H., Terai, K., Nakajima, H., Chiba, A., Fukuhara, S., Mochizuki, N., S1P-Yap1 Signaling Regulates Endoderm Formation Required for Cardiac Precursor Cell Migration in Zebrafish, 128-136, Copyright (2014) with permission from Elsevier. Full text @ Dev. Cell