
- Title
-
Expression analysis of integrin β1 isoforms during zebrafish embryonic development
- Authors
- Wang, X., Li, L., Liu, D.
- Source
- Full text @ Gene Expr. Patterns
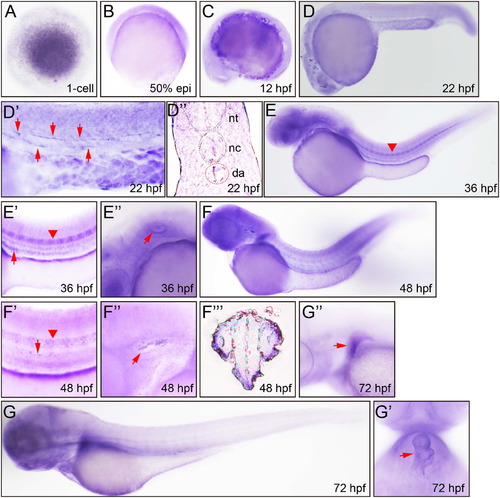
Whole mount in situ hybridization analysis of zebrafish embryos using antisense itgb1a probe. A. 1-cell, dorsal view, weak staining. B. 50% epiboly, lateral view, weak staining. C. 12 hpf, lateral view, epidermis. D. 22 hpf, lateral view, epidermis. D′. 22 hpf, lateral view, dorsal aorta (arrowhead). D″. 22 hpf, transverse section of caudal trunk; nt, neural tube, nc, notochord, da, dorsal aorta. E. 36 hpf, lateral view, overview of whole body, notochord (arrowhead). E′. 36 hpf, lateral view, notochord (arrowhead), dorsal aorta (arrow). E″. 24 hpf, lateral view, otic vesicle. F. 48 hpf, lateral view. F′. 48 hpf, lateral view, notochord (arrowhead), dorsal aorta (arrow). F″. 48 hpf, lateral view, otic vesicle. F‴. 48 hpf, transverse section of head, out layer staining. G. 72 hpf, lateral view. G′. 72 hpf, ventral view, heart (arrow). G″. 72 hpf, lateral view, pectoral fin epidermis (arrow). EXPRESSION / LABELING:
|
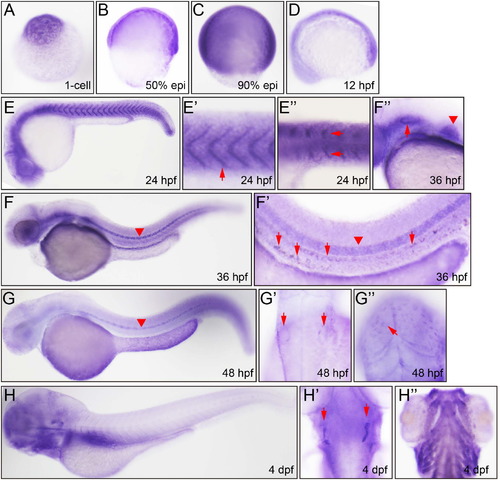
Whole mount in situ hybridization analysis of zebrafish embryos using antisense itgb1b probe. A. 1-cell, lateral view, strong staining. B. 50% epiboly, lateral view. C. 80% epiboly, lateral view. D. 12 hpf, lateral view, epidermis. E. 24 hpf, lateral view. E′. 24 hpf, lateral view, myotome borders (arrow). E′. 24 hpf, dorsal view, myotome borders (arrow) F. 36 hpf, lateral view, notochord (arrowhead). F′. 36 hpf, lateral view, notochord (arrowhead), trunk vessel (arrow). G. 48 hpf, lateral view, notochord (arrowhead). G′. 48 hpf, dorsal view, otic vesicle (arrow). G″. 48 hpf, dorsal view, head epidermis, enveloping layer (EVL). H. 4 dpf, lateral view. H′. 4 dpf, dorsal view, otic vesicle (arrow). H″. 4 dpf, ventral view, branchial arch. |
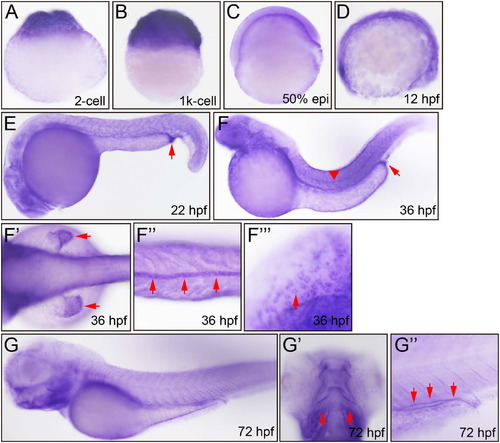
Whole mount in situ hybridization analysis of zebrafish embryos using antisense itgb1b.1 probe. A. 2-cell, lateral view, strong staining. B. 1K-cell, lateral view. C. 50% epiboly, lateral view. D. 12 hpf, lateral view, epidermis. E. 22 hpf, lateral view, epidermis of the whole body, urogenital opening (arrow). F. 36 hpf, lateral view, epidermis of the whole body, urogenital opening (arrow), notochord (arrowhead). F′. 36 hpf, dorsal view, pectoral fin epidermis (arrow). F″. 36 hpf, ventral view, ventral fin (arrow). F‴. 36 hpf, lateral view, head EVL (arrow). G. 72 hpf, lateral view. G′. 72 hpf, ventral view, pharyngeal arch (arrow). G″. 72 hpf, lateral view, intestinal epithelium (arrow). EXPRESSION / LABELING:
|
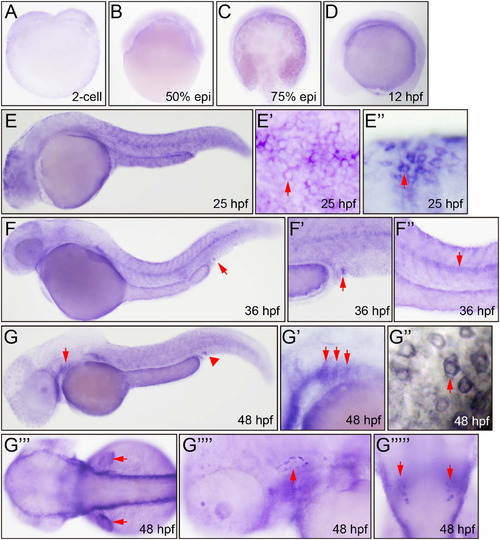
Whole mount in situ hybridization analysis of zebrafish embryos using antisense itgb1b.2 probe. A. 2-cell, lateral view. B. 50% epiboly, lateral view. C. 75% epiboly, lateral view. D. 12 hpf, lateral view, slightly staining of epidermis. E. 25 hpf, lateral view, epidermis. E′. 25 hpf, lateral view, caudal trunk EVL (arrow). E″. 25 hpf, lateral view, head EVL (arrow). F. 36 hpf, lateral view, urogenital opening (arrow). F′. 36 hpf, urogenital opening (arrow). F″. 36 hpf, lateral view, notochord (arrow). G. 48 hpf, lateral view, branchial arches (arrow), urogenital opening (arrowhead). G′. 48 hpf, lateral view, branchial arches (arrow). G″. 48 hpf, ventral view, head epidermis, EVL (arrow). G‴. 48 hpf, lateral view, pectoral fin epidermis (arrow). G″″. 48 hpf, lateral view, otic vesicle (arrow). G″‴. 48 hpf, dorsal view, otic vesicle (arrow). EXPRESSION / LABELING:
|
Reprinted from Gene expression patterns : GEP, 16(2), Wang, X., Li, L., Liu, D., Expression analysis of integrin β1 isoforms during zebrafish embryonic development, 86-92, Copyright (2014) with permission from Elsevier. Full text @ Gene Expr. Patterns