
- Title
-
A Smad3 transgenic reporter reveals TGF-beta control of zebrafish spinal cord development
- Authors
- Casari, A., Schiavone, M., Facchinello, N., Vettori, A., Meyer, D., Tiso, N., Moro, E., Argenton, F.
- Source
- Full text @ Dev. Biol.

D12xSBE lines are reporters of TGFβ signaling. (A) Brightfield, fluorescence and in situ hybridization lateral views of Tg(12xSBE:EGFP)ia16 embryos at 15, 26 and 48 hpf, anterior to the left. GFP expression appears in late somitogenesis in the tail and cardiac mesoderm region. At 26 hpf GFP is visible in the telencephalic region and expressed in the embryo neural tube and tail. At 48 hpf reporter expression is extended to the entire neural tube, maintaining a decreasing gradient from the tail, and in some areas of the brain. Transcription (in situ) and translation (GFP) patterns are coherent. (B) Fluorescent images of 3 dpf larvae of Tg(12xSBE:EGFP)ia16 (in green) and Tg(12xSBE:nlsmCherry)ia15, (in red) either treated with the Alk4- and Alk5-inhibitor SB431542 or with carrier (DMSO) for two days: lateral views, anterior to the left. C. RNA in situ hybridization for EGFP mRNA performed in embryos of Tg(12xSBE:EGFP)ia16 treated at 24 hpf with the Alk4- and Alk5-inhibitor, SB-431542 and fixed at different time points: 2, 4, 6, 8 h post treatment (hpt). EXPRESSION / LABELING:
|
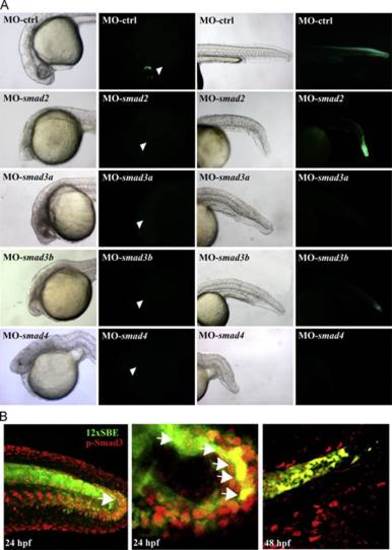
Responsiveness of Tg(12xSBE:EGFP)ia16 line to Smad3. (A) Brightfield and fluorescent lateral images of smad2-, smad3a-, smad3b- and smad4-morphants at 24 hpf at the epifluorescent microscope, left to right. smad2, 3a and 3b morphants show a similar phenotype: anterior truncation, a curved shortened body axis, absence of floorplate and an enlarged intermediate cell mass. smad4 morphants exhibit the most severe phenotype: similar characteristics of the other morphants accompanied with a shortened body due to BMP inhibition. Reporter expression is completely inhibited in smad4 and 3a morphants and strongly reduced in smad3b morphants. smad2 morphants lack GFP expression in the cardiac mesoderm and telencephalon (white arrow head) and display a mild reduction in the neural tube. (B) Phosphorylated-Smad3 correlates to reporter expression in the 12xSBE line. Confocal lateral views of double fluorescent immunohistochemistry for GFP (green) and phosphorylated Smad3 (red) on embryo and larva tails at 24 and 48 hpf; zoomed views on the edge of the tail of a 24 hpf embryo. Arrowheads point to GFP/p-Smad3 double positive cells. |

Tg(12xSBE:nls-mCherry)ia15 line is responsive to smad7 and smad3b overexpression. A–C′′, confocal lateral views (Z-stacks) of 48 hpf double transgenic larvae, Tg(12xSBE:nls-mCherry)ia15/(hs-Smad7/YFP) or (hs-Smad7/YFP). As shown in the schematic 48 hpf larva, three areas have been analyzed: head, trunk and tail. Each picture shows the merge of YFP (green) and mCherry (red) and it is accompanied by a small figure (white square) representing mCherry fluorescence following the heat-shock. (A–A′′) Confocal lateral views of 48 hpf double transgenic larvae, Tg(12xSBE:nls-mCherry)ia15/(hs-Smad7/YFP). Heat-shock causes a downregulation of the 12xSBE reporter (in red) and ubiquitous production of YFP (in green). (B–B3) Confocal lateral images of 48 hpf non-heat-shocked double transgenic larvae, Tg(12xSBE:nls-mCherry)ia15/(hs-smad7/YFP) and Tg(12xSBE:nls-mCherry)ia15/(hs-smad3b/YFP). Only non-heat-shocked Tg(12xSBE:nls-mCherry)ia15/(hs-smad7/YFP) is shown as a control. (C–C′′) Confocal lateral views of 48 hpf heat-shocked double transgenic larvae, Tg(12xSBE:nls-mCherry)ia15/(hs-smad3b/YFP). The heat-shock leads to a smad3b overexpression confirmed by mosaic production of YFP. White arrow heads show ectopic expression in the head, trunk muscle and tail. (D–D′′) Zoomed views (single planes) of Tg(12xSBE:nls-mCherry)ia15/(hs-smad3b/YFP) highlight the ectopic reporter expression induced by smad3b overexpression. Scale bar is 100 µm in A–C′′ 20 µm in D–D′′. Scale bar is 100 µm in A–B′, E–F′, G, H; 50 µm in C′–C′′ and 20 µm in G′, H′. EXPRESSION / LABELING:
|

Reporter expression during early larval development: central nervous system. Confocal images of brain and neural tube of Tg(12xSBE:EGFP)ia16 larvae at different stages of development. (A) Dorsal view of the brain of a 4 dpf larva (Z-stack). GFP is expressed in the hindbrain, diencephalon and telencephalon. (B) Zoomed lateral views of the hindbrain in a larva at 3 dpf (single plane). (C) Dorsal views of GFP-expressing cells in the subpallium of a 10 dpf larva (Z-stack). (C′) Zoomed dorsal view of GFP+ cells in the subpallium (Z-stack). (D) Lateral view of the neural tube in a 72 hpf larva (Z-stack). (D′–D′′), 3D-reconstruction of the neural tube of D at the level of the dashed line (D′, lateral and, D3, sagittal view). Reporter expression is mainly localized around the central canal (cc). (E) Lateral view of an eye in a 36 hpf larva (Z-stack). (F–H) Single planes of Tg(12xSBE:EGFP)ia16 brain at 72 hpf. Images have been obtained with VibeZ software. h=hindbrain, sb=subpallium, cc=central canal, pr=proliferating retina, le=lens, hy=hypothalamus, to=tectum opticum, mo=medulla oblongata. Scale bar is 100 µm in A, D; 50 µm in C; 20 µm in E; and 10 µm in B, C′, D′–D′′. |
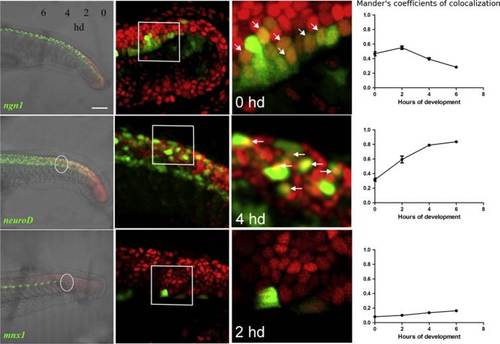
Smad3 reporter is expressed in progenitors and precursors. Confocal lateral view of tail of double transgenic embryos obtained crossing Tg(12xSBE:nls-mCherry)ia15 to the following transgenics: Tg(ngn1:GFP)sb1, Tg(2.4 kb neurod:EGFP) and Tg(mnx1:GFP)ml2. Colocalization was measured in the tail of 24 hpf double transgenic embryos with the following method. From 15 to 24 hpf, two somites are formed each hour. Tail region was divided in pairs of somites and colocalization (Manders′ coefficient referred to TGFβ-mCherry fluorescence) evaluated in four of them (as white dotted circles) starting from the edge of the tail toward the trunk. For each time point, the average value of Manders′ coefficient has been calculated from six double transgenic embryos and plotted on as a function of the corresponding hour of development (hd). Second column: magnification of specific regions (single plane). Third column: double fluorescent cells are shown with arrowheads (single plane). Developmental time of each magnification is indicated inside the panel. Fourth column: graphical representation of quantitative analysis as Manderós coefficients of the four developmental points; n=6 per each point. Scale bar is 100 µm in the first column, 20 µm in the second column, 10 µm in the last column. EXPRESSION / LABELING:
|

Smad3/TGFβ signaling is mainly active in post-mitotic cells. (A–B′) Confocal lateral views of immunofluorescence for GFP (green) and phospho-Histone3 (pH3, red) on Tg(12xSBE:EGFP)ia16 embryos injected at 1–2 cell stage either with the control (A), or smad3a-morpholino (B). For each confocal picture (Z-stack), a small brightfield view of a morphant embryo shows which area is displayed (red dashed line). (C–D) Confocal lateral views of immunofluorescence for GFP (green) and pH3 (red) on 2 dpf larva of Tg(12xSBE:EGFP)ia16 line treated with either DMSO (C) or LY364947 (D) at 24hpf. For each confocal picture (Z-stack), a small brightfield view of a 48 hpf larva shows which area is displayed (red dashed line). (C′ and C′′) Confocal zoomed views (single plane) of hindbrain and tail, respectively, of immunofluorescence for GFP (green) and pH3 (red) on DMSO-treated larva of the 12xSBE line. (E–F) Confocal lateral views of the head (E, F) or tail (E′, F′) regions after EdU labeling on 20 hpf embryos treated at 12 hpf either with DMSO (E, E′) or LY364947 (F, F′). For each confocal picture (Z-stack), a small brightfield view of a morphant embryo shows which area is displayed (red dashed line). (G, H) confocal lateral images (Z-stack) of pulse and chase EdU assay on 24 hpf embryos of Tg(12xSBE:EGFP)ia16 line. Embryos have been fixed after a chase of either 2 (G–G′) or 8 (H–H′) hours (hrs) and immunostained for EdU (red) and GFP (green). EdU+ cells fixed after 2 h are roughly in S/G2 phase, while EdU+ cells fixed after 8 h of chase are post-mitotic. (G′, H′) Zoomed view (single plane) of Tg(12xSBE:EGFP)ia16 tail after 2 or 8 h chase. Scale bar is 100 µm in A–B′, E–F′, G, H; 50 µm in C′–C′&prime& 20 µm in G′, H′. Quantification is presented in Supplemental Table S4. EXPRESSION / LABELING:
PHENOTYPE:
|

In vivo blocking of Smad3/TGFbeta; signaling impairs neuronal differentiation during early embryonic development. Confocal Z-stack tail images of 24 hpf transgenic embryos expressing GFP under control of neuronal promoter: ngn1, neuroD, and mnx1. Embryos were injected with morpholinos for smad3a at 1–2 cell stage or treated at 2 hpf with Alk5-inhibitor LY364947. As shown with an arrowhead, morpholinos and drug treatment give similar results: increase of proliferative cells (ngn1) at tail tip, decrease of differentiating cells (neuroD) and reduction of late differentiating motor neurons (mnx1). ngn1 is Tg(ngn1:GFP)sb1. neuroD is Tg(2.4 kb neurod:EGFP). mnx1 is Tg(hlxb9:GFP)ml2. Quantification of each frame is shown in Supplemental Table S3. Scale bar is 100 µm in all the images. |
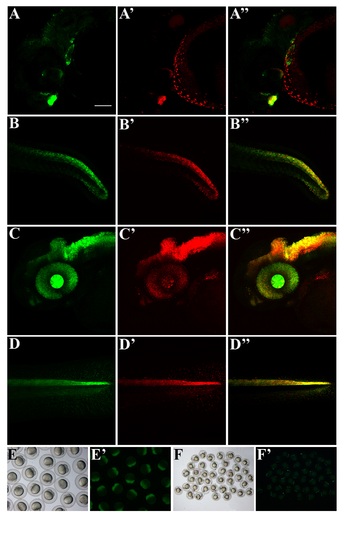
12xSBE lines have similar expression patterns. Confocal lateral views of double transgenic Tg(12xSBE:EGFP)ia16/Tg(12xSBE:nls-mCherry)ia15 24 hpf embryos and 48 hpf larvae, anterior to the left, Z-stack images. A-A′′, head region of a 24 hpf double transgenic embryo: A, green channel; A′, red channel; A′′, merge; B-B′′, tail region of a 24 hpf double transgenic embryo: B, green channel; B′, red channel; B′′, merge; C-C′′, head region of a 48 hpf double transgenic larva: C, green channel; C′, red channel; C′′, merge; D-D′′, tail region of a 24 hpf double transgenic embryo: D, green channel; D′, red channel; D′′, merge. Scale bar is 100 µm. E-E′, brightfield and fluorescent image of GFP+ 2 cell stage embryos from a Tg(12xSBE:EGFP)ia16 female carrier. F-F′ , brightfield and fluorescent image of GFP+ embryos from an outcross of a Tg(12xSBE:EGFP)ia16 male carrier. |

Smad3-regulated EGFP expression is independent from Smad1/5/8-BMP and partially dependent on Nodal signaling. A–D′′′, brightfield and fluorescent lateral views of embryos at 24 hpf. Anterior to the left. A–A′′′: wild type (WT) 24 hpf embryo of the Tg(12xSBE:EGFP)ia16 line. B–B′′′, 24 hpf one-eyed pinhead (oep) mutant of the Tg(12xSBE:EGFP)ia16 line. C–C′′′: 24 hpf chordin (chd) mutant embryo of the Tg(12xSBE:EGFP)ia16 line. A′′′, B′′′, C′′′, arrow head indicates the cardiac mesoderm region. GFP expression is absent in oep mutants. D–D′′, E–E′′, brightfield and fluorescent images of lateral view of 72 hpf larvae of 12xSBE line treated at 24 hpf with DMSO (D–D′′) or LY364947 (E–E′′), anterior to the left. D′′′, E′′′, in situ hybridization lateral view images of a 48 hpf larva treated with DMSO (D′′′) or LY364947 (E′′′) at 24 hpf. EXPRESSION / LABELING:
|

smad2, 3a, 3b and 4 morpholinos are specific for their target. A, smad3a and 3b morpholinos are directed against the start codon of the corresponding target mRNAs. To validate them, control (MO-ctrl) smad3a (MO-smad3a) and smad3b (MO-smad3b) morphants were fixed and phospho-Smad3 production was revealed through an immunohistochemistry. phospho-Smad3 was drastically reduced in MO-smad3a and 3b. B–C, smad2 and 4 morpholinos act on a donor splicing site and their specificity was checked through a RT-PCR. cDNAs were normalized through β-Actin (B-Actin) amplification. B, RT-PCR amplification of RNA from control morphants (MO-ctrl) and smad2 morphants (MO-smad2). There are two splicing variants for smad2 named NSDART00000147653 and NSDART00000044756. smad2 cDNA was amplified with a forward primer in exon 1 and a reverse primer in exon 3. MO-ctrl gave the expected bands of 383 bp (NSDART00000147653) and 304 bp (NSDART00000044756), while in MO-smad2 these PCR products disappeared. In smad2 morphants additional bands clearly appeared caused by the activation of a cryptic splicing site. C, RT-PCR amplification of RNA from control morphant (MO-ctrl) and smad4 morphant (MO-smad4). smad4 cDNA was amplified with a forward primer in exon 3 and a reverse primer in exon 5. In MO-ctrl we observed the expected single band of 438 bp, while in MO-smad4 this PCR product was almost completely absent. |
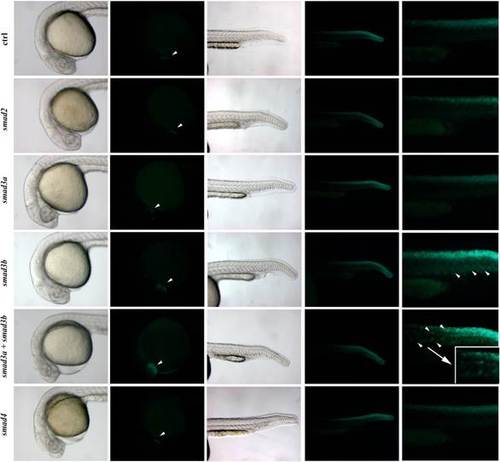
Tg(12xSBE:EGFP)ia16 line is responsive to the overexpression of smad3b and in addition, smad3a together with smad3b: effects of mRNA injection on embryos with a normal phenotype. Brightfield and fluorescent images of head and tail of 24 hpf embryos injected with smad2, 3a, 3b and 4 mRNAs. The last column shows zoomed view of the tails. White arrow heads in fluorescent head pictures point out the cardiac mesoderm. Injection of smad3b and smad3a+smad3b mRNAs causes an increase of GFP expression in this area. In the same injected embryos overexpression of GFP is also visible in tail mesoderm (white arrow heads). Overexpression of both smad3 isoforms results in an ectopic GFP production in notochord (zoomed view of GFP+ notochord is surrounded by a white square). |
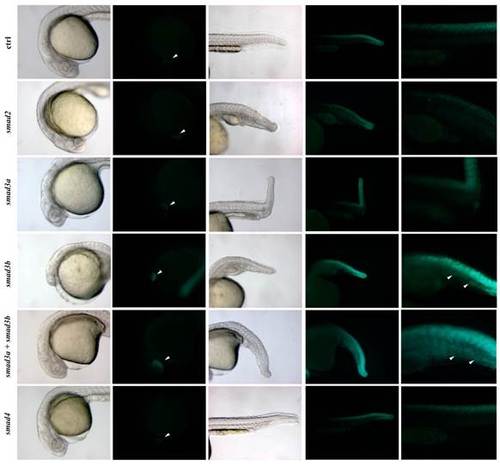
Tg(12xSBE:EGFP)ia16 line is responsive to the overexpression of smad3b, and smad3a together with smad3b: effects of mRNA injection on embryos with a malformed phenotype. Brightfield and fluorescent images of head and tail of 24 hpf embryos injected with smad2, 3a, 3b and 4 mRNAs. The last column shows a zoomed view of the tails. White arrow heads in fluorescent head pictures point out the cardiac mesoderm. Injection of smad3b and smad3a+smad3b mRNAs causes an increase of GFP expression in this area. In the same injected embryos overexpression of GFP is also visible in tail mesoderm (white arrow heads). |
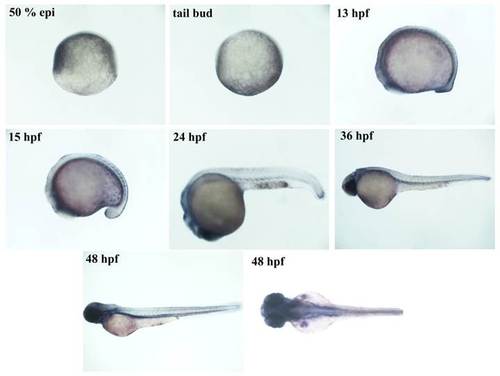
phospho-Smad3 expression pattern correlates with reporter expression. Brightfield images of immunohistochemistry for phospho-Smad3 performed on wild-type embryos at the following developmental stages: 50 % epiboly, tail bud, 13, 15, 24, 36 and 48 hpf. During gastrulation the maternal derived transcription factor is active in the anterior part of the animal pole. It is absent at the end of the gastrulation and it appears again during late somitogenesis (13 hpf) in the tail, eyes and cardiac mesoderm. At 15 hpf it is extended to tail mesoderm. At 24 hpf a weak signal is visible in the cloaca and head. At 48 hpf tail mesoderm signal disappears, while fin buds become positive. EXPRESSION / LABELING:
|
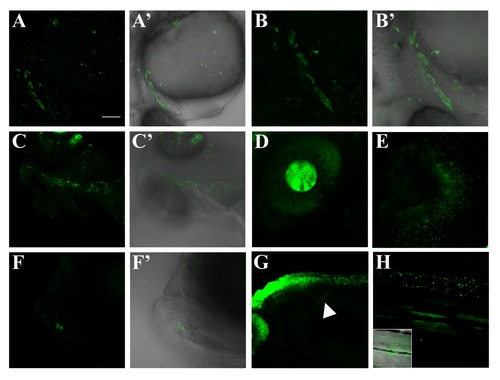
Confocal images of GFP-positive regions external to CNS during the first month of development. A-A′, confocal lateral view of 26 hpf embryo (Z-stack). Reporter gene is activated in the cardiac mesoderm and around the outflow tract. Spare cells are also visible in the yolk ball. B-B′, zoomed heart region of a 26 hpf embryo (Z-stack). C-C′, ventral view of heart and dorsal aorta of a 4 dpf larva (Z-stack). GFP expression in this area is no longer visible beyond this stage. D, zoomed view of the eye of a 48 hpf larva (Z-stack). GFP-positive cells are visible both in retina and lens. E, zoomed view of an olfactory pit of a 6 dpf larva (Z-stack). F-F′, magnified image of the jaw of a 5 dpf larva (Z-stack). Few cells are visible in this area during the early larval development; G, lateral image of a 48 hpf larva: hindbrain, spinal cord and fin bud (white arrowhead). H, zoomed lateral view of the trunk region of a 40 dpf larva, with the correspondent bright field. Reporter expression is still present in the neural tube. Some fibers of the median musculature seem to activate Smad3-mediated signaling during this developmental stage. Scale bar is 100 µm in A-A′, C-C′, F-G; 50 µm in B-B′, H; 20 µm in D; 10 µm in E. EXPRESSION / LABELING:
|

Reporter expression is associated with neuronal differentiating cells. Confocal lateral view (Z-stack) of the tail of 2, 3 and 4 dpf larvae Tg(12xSBE:nls-mCherry)ia15 line with transgenic strains expressing GFP in different neuronal cells: Tg(ngn1:GFP)sb1, Tg(2.4 kb neuroD:EGFP) and Tg(mnx1:GFP)ml2. Arrowheads highlight regions of colocalization for GFP and mCherry in Tg(ngn1:GFP)sb1 and Tg(2.4 kb neuroD:EGFP): notice the coexpression at the tail tip of ngn1:GFP. The tails of each double transgenic are accompanied in the last column with a quantitative analyses of colocalization of TGFβ-mCherry expressed as Manders′ coefficient. |

In vivo blocking of Smad3/TGFβ signaling impairs neuronal differentiation during early larval development. Confocal Z-stack images of the trunk of 72 hpf transgenic embryos expressing GFP under control of either a glial or neuronal promoter: ngn1, neuroD and mnx1. All these transgenic lines have been treated at 24 hpf with Alk5-inhibitor LY364947 and confocal observation performed after two days of treatment. Disturbing Smad3/TGFβ signaling at early larval development causes an increase of proliferative cells (ngn1), decrease of differentiating cells (neuroD) and reduction of late differentiating motor neurons (mnx1). |
Reprinted from Developmental Biology, 396(1), Casari, A., Schiavone, M., Facchinello, N., Vettori, A., Meyer, D., Tiso, N., Moro, E., Argenton, F., A Smad3 transgenic reporter reveals TGF-beta control of zebrafish spinal cord development, 81-93, Copyright (2014) with permission from Elsevier. Full text @ Dev. Biol.