
- Title
-
Spatial pattern of cell geometry and cell-division orientation in zebrafish lens epithelium
- Authors
- Mochizuki, T., Suzuki, S., Masai, I.
- Source
- Full text @ Biol. Open
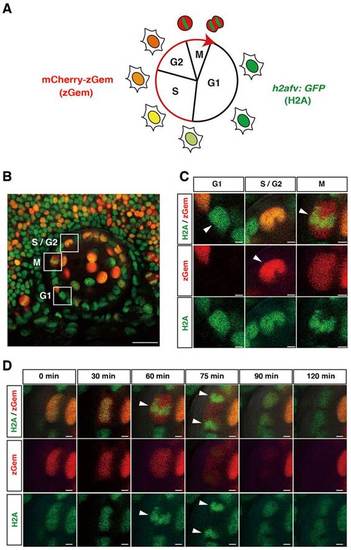
(A) Fluorescent expression in a zebrafish transgenic line Tg(h2afv:GFP; EF1α:mCherry-zGem). In G1 phase, only GFP is expressed in the nucleus. mCherry fluorescence gradually increases during S phase and peaks in G2/M phase. In M phase, GFP fluorescence indicates condensed chromatin. (B) Lateral view of a 37hpf lens of a zebrafish transgenic embryo Tg(h2afv:GFP; EF1α:mCherry-zGem). Squares indicate cells in G1, S/G2 and M phases. (C) Higher magnification of squares shown in (B). Red and green channels are shown below. Arrowheads indicate GFP fluorescence in G1 phase, mCherry fluorescence in S/G2 phase, and condensed GFP fluorescence in M phase. (D) GFP and mCherry expression during M phase. During mitosis, GFP fluorescence is condensed and aligned along the plane of division (arrowhead in 60min). GFP fluorescence is segregated in opposing directions (arrowheads at 75min) and becomes a round shape at 90min. mCherry fluorescence disappears at 120min. Scale bars: 20µm (B), 2µm (C,D). |

(A) Coordinates of the lens. The “z-axis” indicates the distance from the antero-most plane. The “r-axis” indicates the radiusin the plane perpendicular to the z-axis. (B) Nuclear positions of lens epithelial cells for a particular lens at the beginning (37hpf, red line) and the end (45hpf, blue line) of the scanned period. Right red and blue trapezia indicate the retinal ciliary marginal zone that was associated with the lens surface at 37 and 45hpf, respectively. During the period from 37 to 45hpf, the lens grew to be slightly larger, but the z-position of the equator was not changed at z = 45µm. (C) Confocal images of the lens along the z-axis at 37hpf. The lens epithelium is distinguished as monolayer covering the lens fiber core. Dotted lines indicate the boundary between the lens epithelium and the lens fiber core. (D) Averaged percentages of G1/G0, S/G2 and M phase cells relative to the total number of lens epithelial cells along the z-axis, calculated using time-lapse scanning images every 15min during the period from 37 to 45hpf. The equator position z = 45µm is indicated by red color. Scale bars: 20µm. |
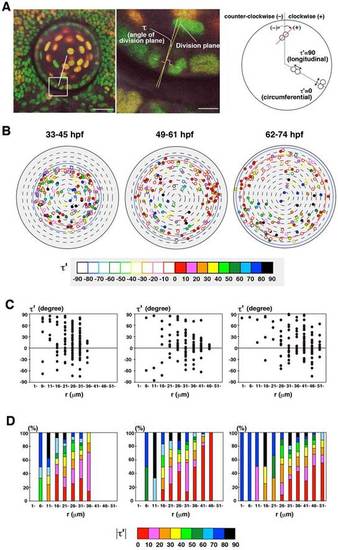
(A) Measurement of the orientation of cell division. Cell-division orientation is defined as τ′, the angle between the line connecting segregating daughter cell chromatins and the circumferential line of the lens sphere. τ′ was calculated from τ, the angle between the r-axis and the cell-division plane, which was perpendicular to the line connecting segregating chromatins (see Materials and Methods). τ′ = 0 and 90 indicate circumferential and longitudinal cell division, respectively. Plus and minus indicate clockwise and counter-clockwise orientation, respectively. (B) Plotting of cell-division orientation in a projection view of the lens epithelium at three time windows: 33–45, 49–61, 62–74hpf. Samples of mitoses were the same as shown in Fig.3A. Cell-division orientation is indicated by color codes red (τ′ = 0–10), pink (τ′= 11–20), orange (τ′ = 21–30), yellow (τ′ = 31–40), light green (τ′ = 41–50), dark green (τ′ = 51–60), light blue (τ′ = 61–70), blue (τ′ = 71–80), and black (τ′ = 81–90). Closed and open circles indicate clockwise and counter-clockwise orientations, respectively. (C) Plotting of τ′ of individual mitotic cells along the r-axis. Mitotic cells with low τ′ value (30<τ′ <30) is zero in the most anterior region (0<r<10), but increased in the peripheral region. Furthermore, the number of cells with the positive value of τ′ is higher than that of the negative value in all stages. (D) Histogram of absolute τ′ value along the r-axis. The fraction of cells with circumferential cell division is low in the anterior region, but gradually increased in a peripheral direction, and was dominant in the peripheral region. Scale bars: 20µm (A, left panel), 5µm (A, right panel). |
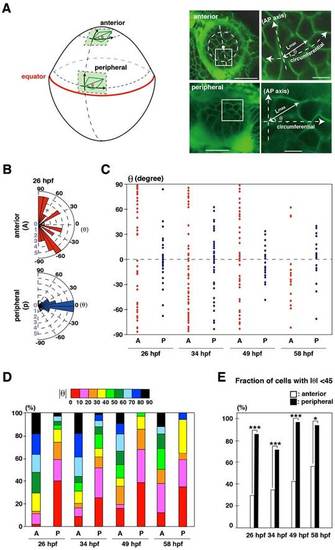
(A) The orientation of the long axis is defined as the angle θ between the long axis and the circumferential line of the lens sphere. Plus and minus values indicate clock-wise and counter-clockwise directions. (B) Graph of the long-axis orientation at 26hpf. Red and blue bars indicate the number of cells with a particular range of angle in the anterior and peripheral region, respectively. Longitudinal orientation is prominent in the anterior region, whereas circumferential orientation is prominent in the peripheral region. (C) Plotting of θ at 26, 34, 49 and 58hpf. Red and blue dots represent individual epithelial cells in the anterior and peripheral regions, respectively. Circumferential orientation (-45°<θ<45°) is prominent in peripheral region. There seems to be no bias between the clockwise and counter-clockwise directions. (D) Histogram of absolute θ. Long-axis orientation is indicated by color codes. 30-50% of lens epithelial cells have θ less than 40° in the anterior region, but 70-95% do in the peripheral region, suggesting that longitudinal and circumferential orientations are prominent in anterior and peripheral regions, respectively. (E) Percentage of the number of lens epithelial cells whose long axis is circumferentially oriented (45°<θ<45°). The long axis is circumferentially oriented in the peripheral region through all stages. Probability was calculated by χ2-test: *p<0.05, ***p<0.005. Scale bars: 20µm (A, left panels), 5µm (A, right panels). |