
- Title
-
Altered Behavioral Performance and Live Imaging of Circuit-Specific Neural Deficiencies in a Zebrafish Model for Psychomotor Retardation
- Authors
- Zada, D., Tovin, A., Lerer-Goldshtein, T., Vatine, G.D., Appelbaum, L.
- Source
- Full text @ PLoS Genet.
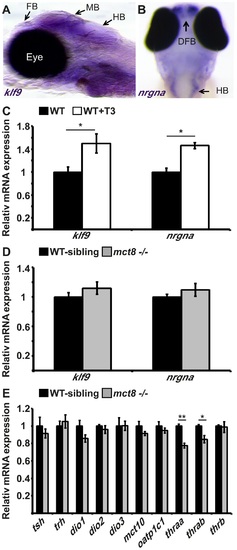
The expression of TH-induced and HPT-axis genes in mct8-/- embryos. A. The expression pattern of klf9 in the forebrain (FB), midbrain (MB), and hindbrain (HB) of 6 dpf larvae (lateral view), as detected by whole-mount ISH. B. nrgna is predominantly expressed in the dorsal forebrain (DFB) and HB in 3 dpf embryo (dorsal view), as detected by whole-mount ISH. C. Relative mRNA expression levels of klf9 and nrgna in untreated and T3-treated WT embryos. D. Relative mRNA expression of klf9 and nrgna in 3 dpf mct8-/- and their WT-sibling embryos. E. Relative mRNA expression levels of tsh, trh, dio1, dio2, dio3, mct10, oatp1c1, thraa, thrab and thrb in 3 dpf mct8-/- and their WT-sibling embryos. Values represented as means±SEM (standard error of the mean). Statistical significance determined by t-test: two-sample assuming unequal variances followed by one-Sample Kolmogorov-Smirnov test. EXPRESSION / LABELING:
|
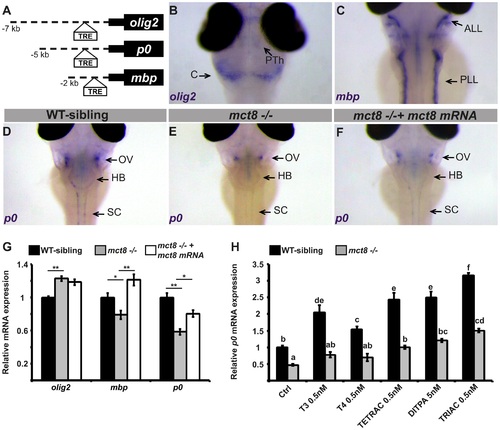
Altered expression of myelin-related genes in mct8-/- embryos is recovered by TH analogs.A. The location of putative thyroid response elements (TRE) in the 7, 5, and 2 kb promoter regions of the zebrafish olig2, p0, and mbp genes, respectively. B-F. Whole-mount ISH experiments detected the spatial mRNA expression in 3 dpf embryos (dorsal views) B. olig2 is predominantly expressed in the prethalamus (PTh) and cerebellum (C). C. mbp is expressed primarily in the anterior and posterior lateral line (ALL and PLL, respectively). D. p0 is primarily expressed in a cluster of cells above the otic vesicle (OV), the HB, and spinal cord (SC) in WT-sibling embryos. E. Low expression levels were detected above the otic vesicle in mct8-/- embryos. F. The expression pattern of p0 was recovered in mct8 mRNA-injected mct8-/- embryos. G. Relative mRNA expression of olig2, mbp, and p0 in 3 dpf WT-sibling, mct8-/-, and mct8 mRNA-injected mct8-/- embryos. Values represented as means ±SEM (standard error of the mean). Statistical significance determined by one-way ANOVA followed by a Tukey test (*p<0.05, **p<0.001). H. Relative mRNA expression of p0 in 3 dpf WT-sibling and mct8-/- embryos treated with 0.5 nM T3, 0.5 nM T4, 0.5 nM TETRAC, 5 nM DITPA, and 0.5 nM TRIAC compared to control (Ctrl, treated with 5×10⁻⁶ M NaOH) WT-sibling and mct8-/- embryos. Values represented as means ±SEM. Statistical significance determined by two-way ANOVA followed by a Tukey test. Different letters indicate significant difference. EXPRESSION / LABELING:
PHENOTYPE:
|
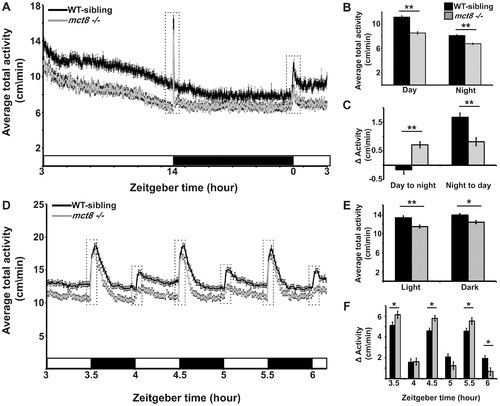
MCT8 mutant exhibits reduced locomotor activity and altered responses to light/dark transitions. Locomotor activity recording was performed in 6 dpf mct8-/- larvae and their WT siblings throughout a daily cycle under a 14 h light/10 h dark cycle (A-C), or during 3 h of 30 min light/30 min dark intervals (D-F). White and black horizontal boxes represent light and dark periods, respectively. Average total activity of each genotype was measured as the average distance movement in 1 min (A and D). Dotted boxes represent 1 h and 5 min (in A and D, respectively) before and after the light-to-dark and dark-to-light transitions. The average total activity of each genotype was measured during day and night as well as during short light and dark periods (B and E, respectively). Differences in the average total activity of each genotype were calculated by comparing 1 h after and 1 h before the day-to-night and night-to-day transitions, as well as by comparing 5 min after and 5 min before light-to-dark and dark-to-light transitions (C and F, respectively). Values are represented as means±SEM (standard error of the mean). Statistical significance determined by t-test: two-sample assuming unequal variances (*p<0.05, ** p<0.001). PHENOTYPE:
|

Sleep architecture of mct8-/- larvae. A-C. Recording of sleep was performed in 6 dpf mct8-/- and WT-sibling larvae during 24 h under a 14 h light/10 h dark cycle. Total sleep time (A), the number of sleep/wake transitions (B) and sleep-bout length (C) monitored in mct8-/- and WT-sibling larvae. Values are represented as means±SEM (standard error of the mean). Statistical significance was determined by t-test: two-sample assuming unequal variances (** p<0.001). PHENOTYPE:
|

Loss of MCT8 reduces synaptic density in axonal arbors of the motor neuron. A-C. Confocal imaging of a 2 dpf live tg(mct8:EGFP) embryo co-injected with huc:GAL4 and uas:tRFP constructs revealed co-localization of mct8 (green) and the huc pan-neural marker (red) in a motor neuron. D. Schematic illustration of an axonal arbor in a motor neuron. Each color represents a single branch that was subjected to ImageJ software analysis. E. Lateral view of a 3 dpf tg(huc:GAL4Xuas:memYFP) embryo. memYFP expression driven by the huc promoter is observed in the spinal cord (SC) and in descending motor neurons. The dashed frame marks a single motor neuron that was selected for further comparative studies. High magnification of the framed area is shown in the trunk of 6 dpf tg(huc:GAL4Xuas:memYFP)/mct8+/- and tg(huc:GAL4Xuas:memYFP)/mct8-/- representative larvae (F and G, respectively). H. Lateral view of a 30 hpf tg(mct8:GAL4Xuas:SYP-EGFP) embryo. SYP-EGFP expression driven by the mct8 promoter is observed in the spinal cord (SC) and in descending motor neurons. In order to compare the number of synapses in mct8+/- and mct8-/- larvae, single motor-neuron arbors were selected (dashed frame). High magnification of the dashed frame is shown in 6 dpf tg(mct8:GAL4)/(uas:SYP-EGFP)/mct8+/- and tg(mct8:GAL4)/(uas:SYP-EGFP)/mct8-/- representative larvae (I and J, respectively). The total arbor length (K) and the number of branches (L) were measured in 3 and 6 dpf mct8+/- larvae and in 3 and 6 dpf mct8-/- larvae. M. Synapse density in the axons of the motor-neurons was measured along the last 50 µm of a single branch in 3 and 6 dpf mct8+/- larvae and in 3 and 6 dpf mct8-/- larvae. N. The total number of synapses was measured in the motor-neuron arbor of 6 dpf mct8+/- and mct8-/- larvae. Scale bar = 30 µm. Values represented as means±SEM (standard error of the mean). Statistical significance determined by t-test: Two-sample assuming unequal variances followed by one-sample Kolmogorov-Smirnov test, to assume normal distribution (*p<0.05). |

MCT8 regulates axon branching in the Rohon-Beard sensory neurons. A. A representative scheme of the Rohon-Beard (RB) sensory neuron location in zebrafish larvae. B-D. Double fluorescent ISH in 33 hpf embryos revealed co-localization of p2rx3.1 (green) and mct8 (red) in RB cell bodies. E-F. Whole mount ISH showed the spatial expression of p2rx3.1 in the dorsal spinal cord of 2 dpf WT-sibling (E) and mct8-/- larvae (F). G-I. Whole-mount ISH and immunofluorescence revealed co-localization of EGFP (green) and p2rx3.1 (red) in the cell body of an RB neuron in 2 dpf huc:GAL4+uas:memYFP-injected embryos. J. The percentages of embryos that express memYFP in single arborized RB neurons in the tail (black bars), are shown in 2 dpf WT-sibling, mct8-/- and mct8 mRNA-injected mct8-/- embryos. Statistical significance was determined by the Chi square test. Different letters indicate significant difference. K. The percentages of embryos that express memYFP in single arborized RB neurons in the tail (black bars), are shown in 2 dpf WT-sibling, mct8-/-, WT-sibling treated with 0.5 nM TRIAC and mct8-/- treated with 0.5 nM TRIAC. Statistical significance was determined by the Chi square test. Different letters indicate significant difference. L, M. Lateral view of arborized RB-neuron that projects toward the tail in 2 dpf live mct8-/- and WT-sibling embryos, which are transiently expressed huc:GAL4 and uas:memYFP constructs. N. Schematic illustration of arborized RB sensory neuron. Each color represents a single branch that was subjected to ImageJ software analysis. Filopodia are colored in black. The total length (O), average length (P), and number of branches (Q) measured in mct8-/- and WT-sibling embryos. Scale bar = 30 µm. Values represented as means±SEM (standard error of the mean). Statistical significance determined by t-test: Two-sample assuming unequal variances followed by one-sample Kolmogorov-Smirnov test, to assume normal distribution (*p<0.05). |
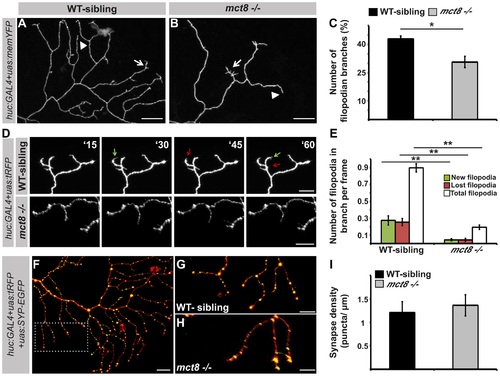
MCT8 reduces filopodia dynamics in the axons of RB neurons. A-B. High magnification views of the dotted area shown in Fig. 7L and 7M, respectively. Arrows mark branches that contain filopodia and arrowheads mark branches that lack filopodia. C. Number of filopodian branches in mct8-/- and WT-sibling embryos. D. Time-lapse live imaging of axon arbor of RB sensory neuron (15 min intervals during 135 min). A representative series of images that were taken every 15 min in live mct8-/- and WT-sibling embryos is shown. Filopodia dynamics is defined as the number of new (green arrows) and lost (red arrows) filopodia per branch over time. E. Filopodia dynamics per branch during 150 min. F-H. Live imaging of synapses in the axons of the RB sensory neurons. F. Lateral view of axons and synapses marked with tRFP and SYP-EGFP, respectively. The dotted frame marks the area shown in high magnification in G and H. I. Synapse density in the RB-neuron arbor of mct8-/- and WT-sibling embryos measured along the last 50 µm of a single branch. Scale bar = 30 µm. Values represented as means ±SEM (standard error of the mean). Statistical significance determined by t-test: two-sample assuming unequal variances followed by one-sample Kolmogorov-Smirnov test to assume normal distribution (*p<0.05, ** p<0.001). PHENOTYPE:
|