
- Title
-
Efficient homologous recombination-mediated genome engineering in zebrafish using TALE nucleases
- Authors
- Shin, J., Chen, J., Solnica-Krezel, L.
- Source
- Full text @ Development
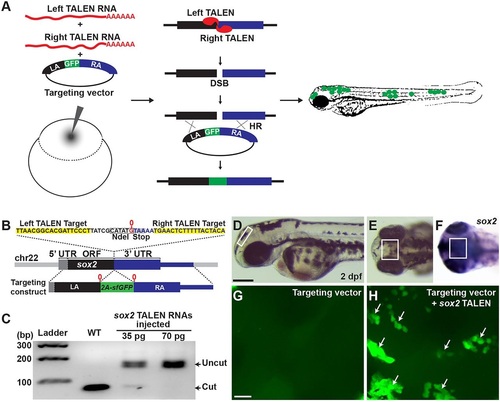
In vivo recombination analysis. (A) Overview of HR detection system by co-injection of TALEN RNAs and a GFP-inserted targeting construct in zebrafish embryos. (B) TALEN target in the sox2 locus and a sox2-targeting construct. Black, gray and blue blocks represent ORF, 5′ UTR and 3′ UTR, respectively (sox2 has no introns). G (0 position, marked in red) just before the stop codon is duplicated in the targeting construct locus and the 2a-sfGFP fragment is inserted in between the Gs. (C) sox2 TALEN RNAs were injected without any donor DNA and its mutagenic activity was measured by PCR and restriction enzyme analysis. Each lane represents an NdeI-digested amplicon encompassing sox2 TALEN target sequence from genomic DNA isolated from five embryos. The NdeI-digested wild-type PCR products are 78 and 75bp. (D-F) Lateral (D) and anterior-dorsal (E,F) views of 2dpf wild-type embryo. Box marks dorsal diencephalon region. (F) Detection of sox2 transcripts by whole-mount in situ hybridization. Scale bar: 200µm. (G,H) Confocal microscope images of the brain region that is similar to that shown in the boxed areas in D-F. (G) An embryo injected with a circular form of a sox2 reporter targeting construct. (H) An embryo co-injected with circular form of the construct and sox2 TALEN RNAs. Groups of cells expressing sfGFP in the diencephalon region are indicated by arrows. Scale bar: 20µm. |
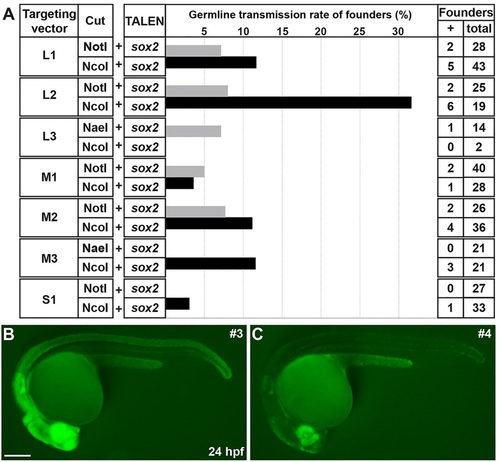
Germline transmission rates of sox2-2a-sfGFP knock-in lines. (A) The frequency of germline transmission of the founders that were co-injected with sox2 TALEN and each targeting construct, which was linearized by either NotI or NcoI. The bars represent the percentage of F0 founders that produced sfGFP-positive F1 progeny. (B,C) Comparison of sfGFP expression between strong and weak sox2-2a-sfGFP F1 embryos. Epifluorescence stereomicroscopic images of sfGFP expression. Lateral views of 1dpf embryos. Both images were taken with the same exposure time. (B) The strong sfGFP-positive F1 embryos obtained from line 3. (C) The weak sfGFP-positive F1 embryos obtained from line 4. Scale bar: 200µm. EXPRESSION / LABELING:
|

Analysis of sox2-2a-sfGFP knock-in lines. (A) Schema of HR-mediated sfGFP insertion. Either NotI (or NaeI) or NcoI-digested targeting constructs (M1, M2, M3 and S1, see Fig. 2A) were co-injected with sox2 TALEN RNAs. Red bar indicates the probe sequences used for Southern blot. (B) Southern blot analysis. PstI/BamHI double-digested genomic DNA from individual adult fish was hybridized with the probe (red bars in A). Expected fragment size: wild type, 6.5kb; targeted, 7.3kb. Arrowheads indicate bands of unexpected size (lane 8, ~10kb; lane 9, ~14kb; lane 10, ~10kb). (C-G) PCR genotyping analysis. Primer pair locations are shown in A. WT, wild type; 1-12, sox2-2a-sfGFP F1 lines (see Table 1). (C) Detection of sfGFP (sF1+sR1 primers). (D) Amplicon extended from 5′ of the LA to within the sfGFP sequences (sF2+sR2). (E) Amplicon spanned the entire RA sequences (sF3+sR3). Arrowhead indicates a fragment of aberrant size (7.5kb). (F) Amplicon extended from 5′ of the LA to 3′ of the RA sequences (sF2+sR3). Expected amplicon size: wild type, 3.5kb; targeted, 4.3kb. (G) Amplicon for vector-specific sequences (F4+R4). (H) Quantitative PCR analysis of sfGFP relative copy numbers. Data are mean±s.e.m. (I,J) Lateral views of 2dpf embryos. (I) sox2 expression in wild type. (J) sfGFP expression in sox2-2a-sfGFPstl84. Arrows indicate neuromasts. Scale bars: 200µm. (K-N) Transverse spinal cord section of 7 dpf sox2-2a-sfGFPstl84 larva. (K) sfGFP expression. (L) Anti-HuC/D antibody staining. (M) Anti-Sox10 antibody staining. (N) Merged image of K-M. Brackets indicate sfGFP-positive cell clusters in posterior median sulcus (top) and posterior median septum (bottom). Arrows indicate sfGFP-positive and Sox10-positive OPCs. Arrowheads indicate sfGFP-positive and HuC/D-positive neurons. Scale bar: 20µm. |

Analysis of gfap-2a-tdTomato knock-in lines. (A) The strategy for generating gfap-2a-tdTomato knock-in fish. gfap TALEN target sequences and stop codon are highlighted in yellow and gray, respectively. In the targeting construct, LA and RA are marked with black and blue, respectively. Red indicates tdTomato sequences linked to viral 2a peptide sequence. The targeting construct linearized with BamHI to generate an internal cut in LA. (B) Activity test of gfap TALEN RNAs. Each lane represents a BslI-digested amplicon encompassing gfap TALEN target sequence from genomic DNA isolated from individual embryo. The BslI-digested wild-type amplicon products are 112 and 50bp. WT, uninjected control; 35pg and 70pg, injection of 35 or 70pg of gfap TALEN RNA, respectively. (C) Lateral view of 2dpf gfap-2a-tdTomatostl85 knock-in F1 embryo. Scale bar: 200µm. (D-F) Transverse spinal cord section of 7dpf gfap-2a-tdTomatostl85 larva. (D) tdTomato expression. (E) Anti-GFAP antibody staining. (F) Merged image of D and E. Asterisks indicate tdTomato-positive cell bodies. Scale bar: 20µm. (G-K) PCR genotyping analysis. Primer pair locations are shown in A. WT, wild type; 1-6, gfap-2a-tdTomato F1 lines from different founders except lines 3 and 4 (see Table 2). (G) Detection of tdTomato (gF1+gR1 primers). (H) Amplicon extended from 5′ of the LA to within the tdTomato sequences (gF2+gR2). (I) Amplicon spanned the entire RA sequences (gF3+gR3). (J) Amplicon extended from 5′ of the LA to 3′ of the RA sequences (gF2+gR3). Expected amplicon size: wild type, 4.1kb; targeted, 5.6kb. (K) Amplicon for vector-specific sequences (F4+R4). |

Transgene mirrors the endogenous expression of the target gene. (A-F) Lateral view of 2dpf sox2-2a-sfGFPstl84;gfap-2a-tdTomatostl85 double homozygous knock-in embryos. All images were taken with the same exposure time. (A-C) sfGFP expression. (D-F) tdTomato expression. (A,D) Control embryo injected with 100pg of cas9 RNA. (B,E) The embryo co-injected with 100pg of cas9 RNA and 10pg of gRNA targeting sox2. (C,F) The embryo co-injected with 100pg of cas9 RNA and 10pg of gRNA targeting gfap. Scale bar: 200µm. (G,H) Detection of target-specific mutations by T7EI assays. Control, embryo injected with 100 pg of cas9 RNA; 1-5, individual embryos co-injected with 100pg of cas9 RNA and 10pg of gRNA targeting sox2 (G) or gfap (H). (G) The PCR products contain guide RNA target site of sox2. (H) The PCR products contain guide RNA target site of gfap. EXPRESSION / LABELING:
|

Analysis of sfGFP-positive cells of sox2-2a-sfGFP line. Confocal microscope images. All images are transverse sections of 7 dpf sox2-2a-sfGFP larvae. (A-H) Arrowheads indicate HuC/D-positive, sfGFP-positive neurons. Arrows indicate Sox10-positive, sfGFP-positive OPCs. (A-D) Most sfGFP-positive cells are located in periventricular zones of the telencephalon and diencephalon. (E-H) Most sfGFP-positive cells are located in ventricular zones of the hindbrain. (I-K) Asterisks mark HuC/D-positive, sfGFP-positive cells that are putative amacrine cells. Arrows indicate HuC/D-negative, sfGFP-positive cells that are resembled as Müller glia morphologically. EXPRESSION / LABELING:
|