
- Title
-
PICALM modulates autophagy activity and tau accumulation
- Authors
- Moreau, K., Fleming, A., Imarisio, S., Lopez Ramirez, A., Mercer, J.L., Jimenez-Sanchez, M., Bento, C.F., Puri, C., Zavodszky, E., Siddiqi, F., Lavau, C.P., Betton, M., O'Kane, C.J., Wechsler, D.S., Rubinsztein, D.C.
- Source
- Full text @ Nat. Commun.
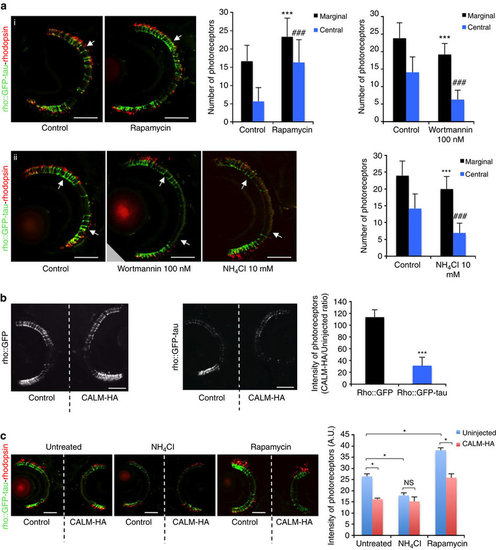
Autophagy and CALM modulate photoreceptor degeneration in zebrafish. (a) rho::GFP-tau fishes were incubated from 3 to 9 d.p.f. in either dimethyl sulphoxide (DMSO) or rapamycin (i) or from 3 to 7 d.p.f in EM alone or 10 mM ammonium chloride or 100 nM Wortmannin (ii). Images through the central retina at 9 d.p.f. (top panel; (i)) reveal rod degeneration (arrow) throughout the retina in control (DMSO-treated) larvae, whereas rod photoreceptors are present throughout the retina, particularly in the central region following treatment with rapamycin (arrow). Images taken through the central retina at 7 d.p.f. (bottom panel; (ii)) show normal photoreceptors in the marginal zones (arrows) and only limited numbers in the central region. NH4Cl exacerbates degeneration-photoreceptors are absent from the central retina and reduced/absent from marginal zones (arrows). Sections were stained with anti-rhodopsin (1D1) antibody. GFP labels whole rod photoreceptors, whereas rhodopsin is present in the rod outer segment. GFP co-localizes with the red rhodopsin label in all experimental conditions. Scale bars, 50 µm. Quantification of rod photoreceptor degeneration (n=10 larvae per group; ***P<0.001; ###P<0.001, two-tailed unpaired t-test). Error bars are mean ±s.d. (b) Full-length CALM electroporation into rho::GFP larvae did not cause degeneration., while full-length CALM electroporation into rho::GFP-tau larvae exacerbated photoreceptor degeneration. Central retina sections in the region of the optic nerve head are presented. Scale bars, 50 µm. Data represent the ratio (in %) of the intensity of the GFP signal between CALM-HA electroporated eye versus control eye for five individuals per transgenic line. ***P<0.05; two-tailed t-test. Error bars are mean ±s.d. (c) NH4Cl treatment of rho::GFP-tau immediately after unilateral CALM electroporation caused photoreceptor degenerationon the control (non-electroporated) side but did not alter the degeneration caused by CALM electroporation. Rapamycin treatment of rho::GFP-tau immediately after unilateral CALM electroporation rescued photoreceptors on the control (non-electroporated) side but not on the CALM-electroporated side. To demonstrate that loss of GFP corresponds to loss of photoreceptors, sections were stained with anti-rhodopsin (1D1) antibody. Wilcoxon signed rank test was used to compare the left eye versus the right eye of the same fish; Mann–Whitney test was used to compare drug treatment in the right eye of different fishes. *P<0.05. Scale bars, 50 µm. Error bars are mean ±s.e.m. PHENOTYPE:
|

CALM modulates the formation of tau-positive tangles in zebrafish. (a) Histological section to demonstrate the individual cell layers of the zebrafish retina. The photoreceptor layer (PR, comprising rod and cone photoreceptors) lies immediately adjacent to the retinal pigment epithelium (RPE) at the outermost surface of the eye. Thioflavin-S labelling of retinal sections was used to identify neurofibrillary tangles in the photoreceptor layer (marked with yellow dotted lines). No labelling was observed in the retina of rho::GFP at 8 d.p.f., whereas distinct thioflavin-S-positive tangles (arrows) were observed in the photoreceptor layer of rho::GFP-tau fish. Note, the RPE is highly autofluorescent due to the presence of silver pigment. High power regions are shown in the top right of each panel. (b) Unilateral electroporation of CALM into the retina of rho::GFP-tau zebrafish resulted in a marked increase in thioflavin-S positive tangles in the electroporated retina in the photoreceptor layer (PR) compared with the control side. Top panel are lower magnification images to show the retinal cell layers. Thioflavin-S labelling is restricted to the PR layer. Note the RPE is highly autofluorescent due to the presence of silver pigment. Bottom panel are higher magnification images to show individual thioflavin-S tangles the largest of which are indicated by arrows. PHENOTYPE:
|