
- Title
-
Deciphering Combinations of PI3K/AKT/mTOR Pathway Drugs Augmenting Anti-Angiogenic Efficacy In Vivo
- Authors
- Sasore, T., Kennedy, B.
- Source
- Full text @ PLoS One

PI3K/Akt/mTOR gene expression in developing Tg(fli1:EGFP) zebrafish. (A) RT-PCR and (B) qPCR examined the mRNA levels of zebrafish pik3ca, pik3r1, mTOR and akt1 genes. Embryos were harvested at 6, 13, 18 or 24 hours post fertilization (hpf) and eyes at 48, 72 or 120 hours post fertilization (hpf). (A). Relative expression, normalised to 18S rRNA, of pik3ca, pik3r1, mTOR and akt1 mRNA levels in developing zebrafish embryos (black columns) and eyes (white columns) expressed relative to the 6 hpf stage. Results are expressed as mean ± S.D. (n = 3), *P<0.05, **P<0.01. |

PI3K/Akt/mTOR inhibitors inhibit developmental angiogenesis of the intersegmental vasculature. Representative images demonstrating anti-angiogenic effects of PI3K/Akt/mTOR inhibitors on ISV development. In 0.1% DMSO-treated control larvae ~25 ISVs pairs develop (A) and high magnification (B). 5 µM NVP-BEZ235 + PI-103 (C), 5 µM LY294002 + NVP-BEZ235 (D) and 10 µM NVP-BEZ235 (E) exhibited significant anti-angiogenic effects compared to individual drugs at 5 µM (F-H). White arrows indicate the ISVs sprouting from the dorsal aorta (DA) to the dorsal longitudinal anastomic vessel (DLAV). Scale bar in A is 500 µm and in B is 100 µm (B). n = 25-30. |
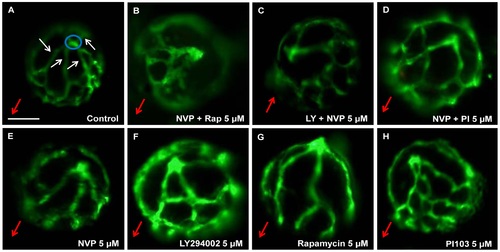
Qualitative effects of PI3K/Akt/mTOR inhibitors on ocular angiogenesis. Representative images demonstrating anti-angiogenic effects of PI3K/Akt/mTOR inhibitors on development of HV. 5 µM NVP-BEZ235 + Rapamycin (B), 5 µM LY294002 + NVP-BEZ235 (C) and 5 µM NVP-BEZ235 + PI103 (D) exhibited significant reductions in primary HV branch number compared to 0.1% DMSO-treated larvae (A). Small, but significant differences were observed in the number of primary branches and overall hyaloid vasculature patterning in 5 µM NVP-BEZ235, 5 µM LY294002, 5 µM Rapamycin and 5 µM -PI103-treated larvae (E-H) compared to control (A). Blue circles depict the optic nerve head. White arrows label primary HV branches emanating from the optic disc at the back of the lens. Red arrows indicate the lens orientation pointing in the direction from the optic disk to the lens. Scale bar 100 µm. N = 26-30. |

Safety pharmacology of PI3K/Akt/mTOR drug combinations in the zebrafish eye and human ARPE19 cells. 2 dpf larvae were treated with the most potent PI3K/Akt/mTOR inhibitors or control (0.1% DMSO) and eye saccades per minute quantified at 5 dpf (A). All PI3K/Akt/mTOR inhibitors reduce the number of saccades per minute compared to control but 5 µM NVP-BEZ235 + PI-103 larvae have a largely intact OKR. Representative images of the gross morphology of treated larvae (B). The most potent drug combinations exhibited little to no effect on overall morphology except for 5 µM NVP-BEZ235 + PI-103 which resulted in reduced eye size. Representative light microscopy images of treated larval eyes (C). Histological analysis was conducted on 1 µm sections of PI3K/Akt/mTOR-treated larvae at 5 dpf with ten sections analyzed per treatment. Retinal morphology appeared as normal in 5 µM NVP-BEZ235 + PI-103 treated larvae, except for a small number of dying cells. Increased number of apoptotic cells was observed in 5 µM LY294002 + NVP-BEZ235 or 5 µM LY294002 + Rapamycin treated larvae. In particular, 5 µM NVP-BEZ235 + Rapamycin (5 µM) exert adverse effects on retinal lamination, RPE, lens and optic nerve integrity. Effects of PI3K/Akt/mTOR inhibitors on viability of human RPE cells (ARPE19) (D-E). Confluent cells were treated with either 0.1% DMSO or PI3K/Akt/mTOR inhibitors individually or in combination (5 µM) for 24 h (D) and 48 h (E) and cell viability was measured by MTT assays. No significant difference was observed in ARPE19-treated cells compared to control. Results are expressed as percentage of control. PI3K/Akt/mTOR inhibitors showed no cytotoxicity on ARPE19 cells. GCL: ganglion cell layer, ONL: outer nuclear layer, INL: inner nuclear layer, ON: optic nerve, RPE: retinal pigment epithelium. Red arrows point to the RPE. Scale bars: B = 50 µm, C = 100 µm. Data are means ± s.e.m. (n = 3). N = 20-25 (A), N = 20 (B). PHENOTYPE:
|