
- Title
-
Pard3 regulates contact between neural crest cells and the timing of Schwann cell differentiation but is not essential for neural crest migration or myelination
- Authors
- Blasky, A.J., Pan, L., Moens, C.B., Appel, B.
- Source
- Full text @ Dev. Dyn.
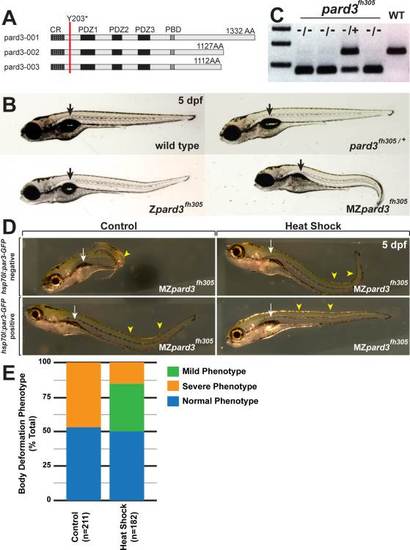
Characterization of maternal and zygotic pard3 functions. A: Schematic representation of zebrafish Pard3 isoforms. Each isoform has a conserved oligomerzation domain (CR), three PDZ domains (PDZ1–3) and a Prkci binding domain (PBD). The pard3fh305 lesion, changing a tyrosine to a stop codon at amino acid position 203 (Y203*) occurs after the oligomerization domain and before the PDZ binding domains (red line). B: Images of 5 dpf wild-type, Zpard3fh305, pard3fh305/+, and MZpard3fh305 larvae. MZpard3fh305 larvae fail to form full swim bladders (arrow) and have a more extreme body curvature than Zpard3fh305 mutants. C: Genotyping test for the pard3fh305 allele. Heterozygotes generate bands of 155 base pairs (wild-type allele) and 68 and 87 base pairs, which appear as one band on the gel (mutant allele). Homozygous mutants, selected on the basis of body curvature phenotype, produce only the 68 and 87 base pair fragments. D: Representative images of 5 dpf MZpard3fh305 larvae either without (“negative”, top row) or with (“positive”, bottom row) the Tg(hsp70I:pard3-GFP) transgene. Larvae in left column are control, non-heat shocked and those in right column were heat shocked. Pard3-GFP expression rescued the body curvature (arrowheads) and swim bladder (arrows) phenotypes. E: Graph showing quantification of heat shock rescue experiment. Larvae were produced by crossing MZpard3fh305 females to pard3fh305/+; Tg(hsp70I:pard3-GFP) males. Non-heat shocked control and heat shocked groups therefore consist of approximately 50% MZpard3fh305 and 50% pard3fh305/+ larvae. Larvae were scored at 5 dpf for severity of body deformation and swim bladder formation. Control, n = 211; heat shock, n = 182. PHENOTYPE:
|
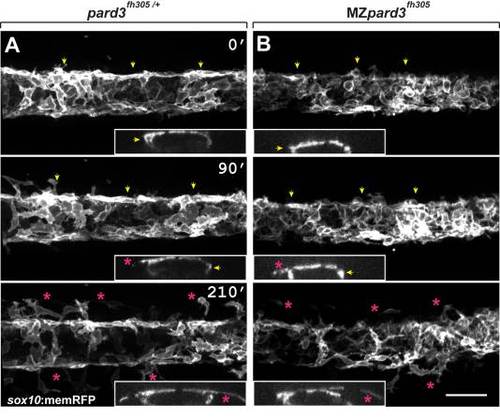
Schwann cells exit the dorsal neural tube on schedule in pard3 mutants. Panels show representative frames from time-lapse movies of trunk neural crest cells between 18–24 hpf. Views are from dorsal with anterior to the left. Insets display z-plane orthogonal views of the migrating neural crest for each frame. Numbers denote time elapsed, in minutes, from start of imaging. Embryos are siblings and imaged sequentially in the same chamber. A: Initiation of neural crest migration in a control pard3fh305/+ embryo. Neural crest cells are marked by sox10:memRFP expression. Arrows mark migration on the medial pathway between neural tube and somites and asterisks mark migration on the lateral pathway, across the dorsolateral surface of somites. B: Migration of neural crest in a MZpard3fh305 mutant embryo. The onset and pattern of migration is similar to the control. Scale bar = 50 µM. PHENOTYPE:
|
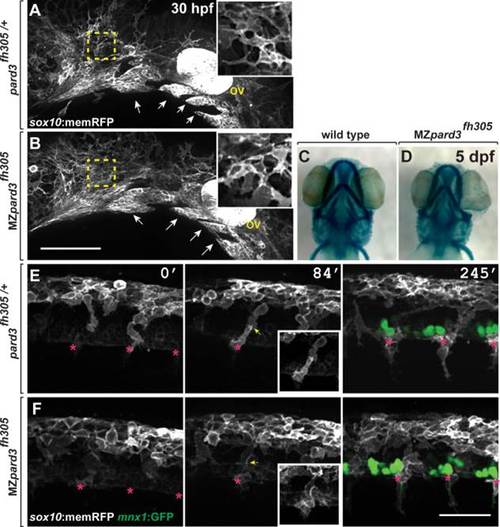
pard3 is not essential for neural crest migration. A,B: Representative images of cranial neural crest marked by Tg(sox10:memRFP) reporter expression in 30 hpf control pard3fh305/+ (A) and MZpard3fh305 mutant (B) embryos. View is from lateral with anterior to the left and dorsal up. Arrows indicate migrating groups of neural crest cells. In some regions, indicated by the outlined boxes and magnified in the insets, neural crest cells appear more tightly packed in mutant than in control. ov, otic vesicle. C,D: Representative images of jaw structures at 5 dpf in wild-type (C) and MZpard3fh305 mutant (B) larvae. The jaw in the mutant larva appears similar to that of wild-type. E,F: Representative frames captured from time-lapse movies of trunk neural crest marked by Tg(sox10:memRFP) reporter expression. Motor neurons and axons are marked by Tg(mnx1:GFP) expression (green) in the final frames of the sequences. Images are from lateral with anterior to the left and dorsal up. Numbers indicate time, in minutes, elapsed from beginning of imaging. Images were captured from 18–24 hpf. In the control embryo (E), neural crest cells form streams (asterisks) with little overlap at points of contact (arrows). By contrast, neural crest cells appear less organized and overlap more in the MZpard3fh305 mutant embryo (F). Scale bar = 100 µM in E,F. EXPRESSION / LABELING:
PHENOTYPE:
|
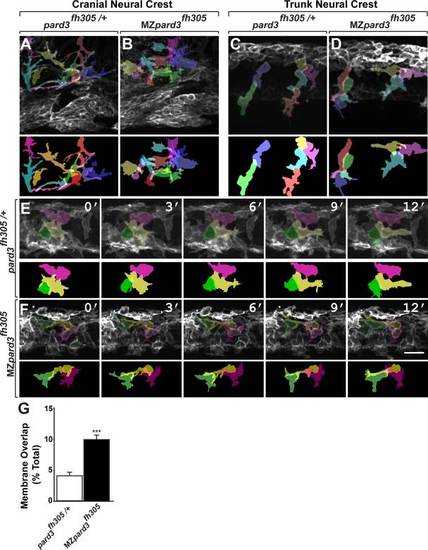
Pard3 mediates contact inhibition between neural crest cells. A-F: Individual neural crest cell tracings represented as colored objects. A,B: Representative images of cranial neural crest cell migration in control (A) and mutant (B) embryos. In some regions, neural crest cells appear more tightly packed in mutant than in control. C,D: Representative images of trunk neural crest cells in control (C) and mutant (D) embryos; lateral view. Neural crest cells form chains elongated in the direction of migration in the control embryo (C). By contrast, neural crest cells appear less elongated and to be less well organized as chains in the mutant (D). E,F: Representative frames captured from time-lapse movies of trunk neural crest cell delamination in control (E) and mutant (F) embryos. Views are from dorsal with anterior to the left. Numbers denote time elapsed, in minutes, from start of imaging. Embryos are siblings and imaged sequentially in the same chamber. Neural crest cells in control embryos (n = 30) retract cell membrane upon contact with neighboring cells. By contrast, neural crest cells in mutant embryos (n=24) fail to retract cell membrane and maintain cell overlap (F). G: Quantification of trunk neural crest cell membrane overlap during delamination (pard3fh305/+, n= 3 embryos, 43 cells; MZpard3fh305, n = 4 embryos, 47 cells; ***P = 0.0001; Student′s t-test). Scale bar = 25 µM. PHENOTYPE:
|

Pard3 localizes at transient points of contact between neural crest cells. A: Image of neural crest cells marked by sox10:tagRFP (white) and Pard3-GFP (green) (24 hpf; lateral view of trunk). Pard3-GFP is concentrated at points of contact between cells (arrows) and forms puncta within cells (arrowheads). B: Images captured from time-lapse movies of neural crest cells (24 hpf; dorsal view of trunk). Numbers indicate time elapsed since beginning of image sequence. Image sequence shows one neural crest cell (white) extending to contact another (red) followed by process withdrawal. Pard3-GFP clusters at the point of contact and then disperses following withdrawal (insets, arrowheads). C: Representative image of Pard3-GFP localization within migrating Schwann cells (20 hpf; lateral view of the trunk) Scale bars = 10 µM in A; 25 µM in B; 15 µM in C. EXPRESSION / LABELING:
|
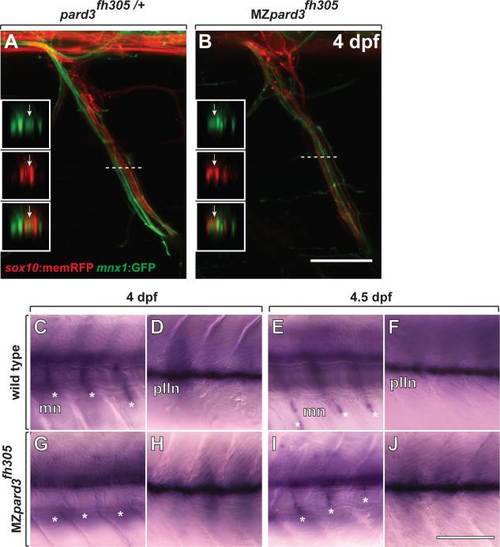
Schwann cells wrap motor axons but delay mbp expression in the absence of pard3 function. A,B: Representative images of control pard3fh305/+ (A) and MZpard3fh305 mutant (B) embryos, focused on a single motor root. Schwann cells are marked by sox10:memRFP (red) and motor axons are marked by mnx1:GFP (green). Schwann cells ensheath motor axons similarly in both control and mutant. Boxes show orthogonal views of motor nerves at the level of the dashed line. Arrows indicate ensheathed motor axons. C-J: Representative images of mbp RNA expression in wild-type and MZpard3fh305 mutant larvae. Views are from lateral of the trunk with anterior to the left and dorsal up. At 4 dpf, mbp expression is evident at motor nerves (mn, asterisks) (C) and the posterior lateral line nerve (pLLn) (D) of a wild-type larva. By contrast, no motor nerve expression is evident at motor nerves of a MZpard3fh305 mutant larva (E) although pLLn expression appears normal (F). At 4.5 dpf, mbp expression is similar in wild-type and MZpard3fh305 mutant larvae at both motor nerves and the pLLn (G-J). Scale bar = 15 µM in A,B; 100 µM in C-J. EXPRESSION / LABELING:
|

pard3 is not essential for Schwann cell myelination. A,B: Transmission electron micrographs of coronal sections through the trunk region of 8 dpf wild-type (A) and MZpard3fh305 mutant (B) larvae. Motor axons are pseudocolored blue. Areas indicated by dashed boxes are shown at higher magnification in insets. Multiple layers of myelin membrane are evident in both wild-type and mutant. C,D: Lateral views of 50 dpf wild-type (C) and MZpard3fh305 mutant (D) zebrafish. Dashed white line indicates region of coronal sections obtained for electron microscopy. MZpard3fh305 mutants are shortened and display severe body deformation, manifesting as a variable curved body axis. E,F: Transmission electron micrographs of coronal sections through the trunk region of 50 dpf fish. Areas indicated by dashed boxes are shown at higher magnification in insets. Myelin ultrastructure is similar in wild-type (E,E′) and MZpard3fh305 mutant (F,F′). Scale bars = 1 µM in A-D; 0.25 µM in A′,B′,C′,D′. PHENOTYPE:
|