
- Title
-
Leading and trailing cells cooperate in collective migration of the zebrafish Posterior Lateral Line primordium
- Authors
- Dalle Nogare, D., Somers, K., Rao, S., Matsuda, M., Reichman-Fried, M., Raz, E., Chitnis, A.B.
- Source
- Full text @ Development
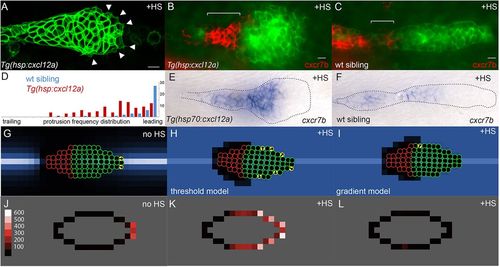
Experimental and simulated overexpression of Cxcl12a. (A) Morphology of PLLp in Tg(hsp:cxcl12a) after 1h of heatshock (corresponding to t=78 min in supplementary material Movie 1). Arrowheads indicate protrusions. (B,C) False-color overlay of cxcr7b in situ hybridization (red) in Tg(hsp70:cxcl12a) (B) and wild-type sibling embryo (C) after heatshock for 1h and recovery for 2h. (D) Frequency of protrusions observed from the leading to the trailing end of the PLLp in embryos with heatshock-induced cxcl12a expression (red bars, six embryos) compared with that in control siblings (blue, six embryos). Each bar represents the frequency of protrusions observed in 5% increments of the relative distance from the leading end of the PLLp observed. (E,F) In situ hybridization for cxcr7b transcript in Tg(hsp:cxcl12a) (E) and wild-type sibling (F) PLLp after a 30min heatshock at 37.5°C and 4h of recovery. (G) Model PLLp without heatshock. (H) Model PLLp after heatshock when turtles are migrating in response to above-threshold levels of Cxcl12a. (I) Model PLLp after heatshock when turtles are migrating in response to the gradient of Cxcl12a. (J-L) Time-averaged position of actively migrating turtles within model PLLp for the conditions in G-I, respectively. Scale (‘protrusions’/1000 model iterations) is in J. Scale bars: 10μm. |

PLLp morphology following laser ablation. (A) PLLp fragments 60min after ablation to separate leading cells from trailing cells. Arrowheads indicate stretching of the leading fragment. (B) As in A, 144min after ablation. Arrow indicates migration of trailing cells toward leading cells. (C) PLLp 135min after complete ablation of trailing cells. Arrowheads indicate stretching of leading fragment. (D) Model ablation showing cxcr4b (green) and cxcr7b (red) turtles. White dots indicate the levels of Cxcl12a along the midline. (E) PLLp fragments 90min after ablation in the presence of 20μM chalcone-4-hydrate. Leading cells adopt a rounded morphology. (F) Same embryo as in E, 148min after ablation. Arrow indicates migration of trailing cells toward leading cells. Scale bar: 10μm. |

PLLp morphology following double laser ablation. (A,B) Schematic of ablation and PLLp fragments 62min after ablation to separate leading, middle and trailing fragments. Arrowhead indicates migration of middle fragment toward leading fragment. (C,D) Schematic of ablation and PLLp fragments 96min after ablation to remove leading and trailing cells. (E,F) Schematic of ablation and PLLp fragments 96min after ablation to separate middle from trailing cells, and remove leading cells. (G,H) Schematic of ablation and PLLp fragments 62min after ablation to separate middle from leading cells, and remove trailing cells. Arrowhead indicates migration of trailing cells toward leading cells. Right panels in B,D,F,H show outlines and centroid position of middle fragments over time (see scale in H). (I) Expression of cxcl12a in the horizontal myoseptum after ablation. (J,K) Expression of cxcr4b (J) and cxcr7b (K) in PLLp immediately following ablation to generate isolated leading and middle fragments. (L,M) Expression of fgf10a (L) and fgfr1 (M) in PLLp immediately following ablation to generate isolated leading and middle fragments. In I-M, dashed lines indicate PLLp fragments. Crosses indicate ablated fragments. (N) Quantification of middle fragment centroid movement in all experimental conditions, as indicated by diagrams (mean±s.e.m.). Statistical significances of all pairwise comparisons between the indicated groups fall between P<0.03 and P<0.001, Student′s t-test. See supplementary material Table S2 for all pairwise statistical comparisons. Scale bars: 10μm. |
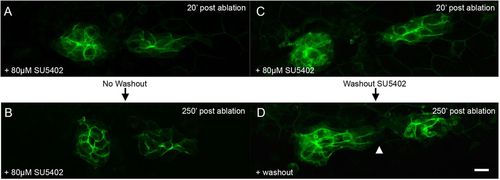
FGF signaling is required for polarized migration of the middle fragment. (A,B) PLLp fragments 20 and 250min after ablation, but in the presence of 80μM SU5402. (C,D) PLLp fragment 20 and 250min after ablation, with subsequent wash-out of SU5402. Arrowhead indicates migration of trailing cells toward leading cells. Scale bar: 10μm. |
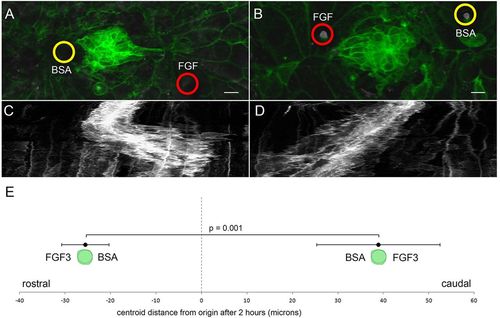
PLLp migration polarized by FGF-soaked beads. (A) Morphology of the middle PLLp fragment after insertion of a FGF3-soaked (red circle) bead caudal to and a BSA soaked (yellow circle) bead rostral to the PLLp fragment. (B) Similar to A with position of the FGF3-soaked (red circle) and BSA-soaked (yellow circle) beads reversed. (C,D) Kymograph of cell behavior during a <400min time-lapse in A and B, respectively. (E) Quantification of movement of centroid position of cells (mean±s.e.m.) with FGF3-soaked beads either rostral or caudal to cells, as indicated. Scale bars: 10μm. |

Expression patterns for a selected set of lateral line genes at 32hpf. Scale bar in A-G 10 μm, in H 50 μm. |
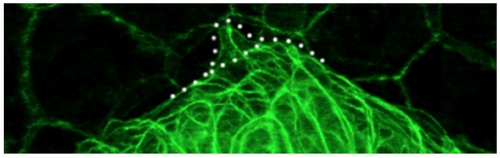
Example of a lateral protrusion from a PLLp after induction of cxcl12a expression quantified in figure 2D. |

Expression of cxcr4b in the PLLp after ablation to sever leading cells. Note that cxcr4b is unpolarized in leading cells, while expression remains polarized in trailing cells, as in the unablated PLLp. Scale bar 10μM. |