
- Title
-
Wnt signaling interacts with bmp and edn1 to regulate dorsal-ventral patterning and growth of the craniofacial skeleton
- Authors
- Alexander, C., Piloto, S., Le Pabic, P., Schilling, T.F.
- Source
- Full text @ PLoS Genet.
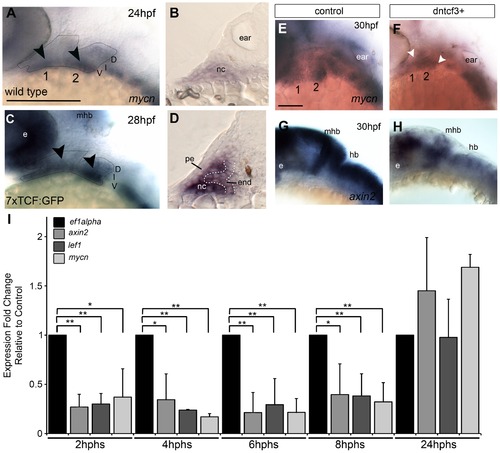
Wnt signaling in the pharyngeal arches. (A–H) In situ hybridization (ISH) and (I) quantitative, real-time PCR (qPCR) analysis of Wnt target gene expression; (A, C, E–H) lateral views, anterior to the left; (B, D) transverse sections through arch 2. (A, B) mycn mRNA is ventrally restricted (black arrowheads) in wild type (WT) embryos. Arches 1 and 2 are outlined by dotted lines. (C, D) GFP mRNA is ventrally restricted (arrowheads) in Tg(7xTCF-Xla.Siam:GFP)ia4 transgenics. (B, D) Both mycn (B) and 7xTCF;GFP (D) are expressed in ventral nc cells and pharyngeal endoderm, and excluded from pharyngeal ectoderm. (E–H) mycn and axin2 expression in controls (E, G), and dntcf3+ embryos at 26 hpf (F, H; heat shocked at 22 hpf). (I) qPCR analysis of axin2, lef1 and mycn expression in dntcf3+ embryos, normalized to nontransgenic, heat-shocked controls, with ef1alpha as an internal control. * P<0.05, ** P<0.001. Abbreviations: e, eye; D, dorsal arch; end, pharyngeal endoderm; hb, hindbrain; I, intermediate arch; mhb, mid-hindbrain boundary; nc, neural crest; pe, pharyngeal ectoderm; V, ventral arch. Scale bars: 100 µm. EXPRESSION / LABELING:
|
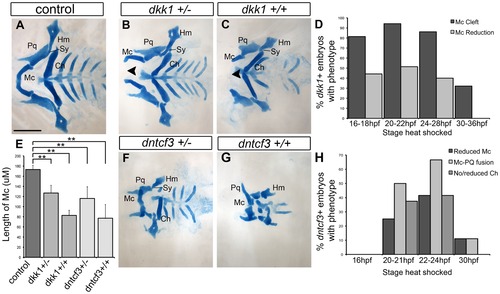
Requirements for Wnt signaling in craniofacial cartilage development. (A–C, F, G) Alcian blue stained cartilage at 96 hpf, dissected and flat mounted, ventral views, anterior to the left. (A) Wild-type control, (B) dkk1+/ heterozygote, (C) dkk1+/+ homozygote, (F) dntcf3+/ heterozygote, (G) dntcf3+/+ homozygote, heat shocked as described (see Results). Arrowheads indicate clefting of Meckel′s cartilage (Mc). (D) Histogram quantifying the frequency of Mc defects in dkk1+ embryos heat shocked at different stages from 16–36 hpf. (E) Histogram quantifying average Mc length, p<0.01. (H) Histogram quantifying the frequency of cartilage defects in arches 1 and 2 in dntcf3+ embryos heat shocked at different stages from 16–30 hpf. Abbreviations: Ch, ceratohyal; Hm, hyomandibular; Mc, Meckels; Pq, palatoquadrate; Sy, symplectic. Scale bar: 100 µm. PHENOTYPE:
|
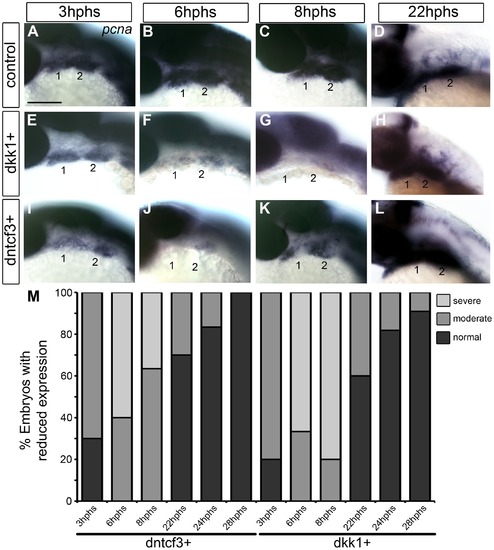
Requirements for Wnt signaling in pharyngeal arch cell proliferation. (A–L) Whole mount ISH for pcna in embryos fixed at 3–22 hours post-heat shock (hphs), lateral views, anterior to the left (all heat shocked at 22 hpf). (A–D) pcna is expressed throughout arches, brain and eyes. (E–H) dkk1+ embryos have reduced pcna expression at 3 hphs (E), severe reductions at 6 hphs (F) and virtually no arch expression at 8 hphs (G), before expression returns at 22 hphs (H). (I–L) dntcf3+ embryos show reduced pcna expression at 3 hphs (I), and virtually no expression at 6 hphs (J, K) before expression rebounds between 8–22 hphs (L). (M) Histogram quantifying percentages of dkk1+ and dntcf3+ embryos with moderate versus severe reductions in pcna expression. Scale bar: 100 µm. |
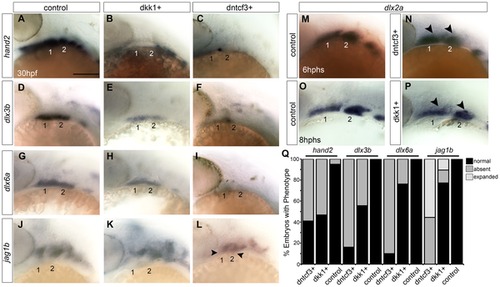
Requirements for Wnt signaling in dorsal-ventral arch patterning. (A–P) Whole mount ISH for genes involved in dorsal-ventral (D-V) patterning in control (A, D, G, J), dkk1+ embryos heat shocked at 20–22 hpf (B, E, H, K), and dntcf3+ embryos heat shocked at 22–24 hpf (C, F, I, L), lateral views, anterior to the left. hand2 (B, C), dlx3b (E, F), and dlx6a (H, I) expression is reduced, while jag1b (K, L) expression expands ventrally (arrowheads) particularly in dntcf3+ embryos, compared with controls. (M–P) dlx2a expression in control (M,O), dntcf3+ (N), and dkk1+ (P) embryos. The dorsal boundary of dlx2a expression (arrowheads) appears to shift ventrally in some cases, (N,P) compared to the control (M,O). (Q) Histogram quantifying percentages of dkk1+ and dntcf3+ embryos with defects in D-V patterning. Scale bar: 100 µm. EXPRESSION / LABELING:
|
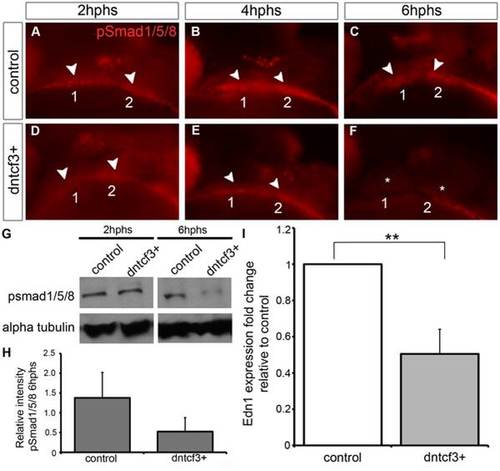
Wnt signaling regulates Bmp and Edn1 signaling in the arches. (A–F) Anti-pSmad1/5/8 staining in control (A–C) and dntcf3+ (D–F) embryos heat shocked at 22–24 hpf, lateral views, anterior to the left. pSmad1/5/8 expression is localized ventrally in the arches (arrowheads), reduced at 2 hphs (D), severely reduced at 4 hphs (E), and absent (asterisk) by 6 hphs (F). (G) Western blot analysis of anti-pSmad1/5/8 in control and dntcf3+ embryos. Protein was extracted at 2 hphs or 6 hphs and alpha tubulin was used as a loading control. (H) Histogram quantifying pSmad1/5/8 expression at 6 hphs, based on Western blots, in control and dntcf3+ embryos, levels normalized to alpha tubulin. (I) Histogram quantifying Edn1 expression by qPCR, in control and dntcf3+ embryos, p<0.01. PHENOTYPE:
|
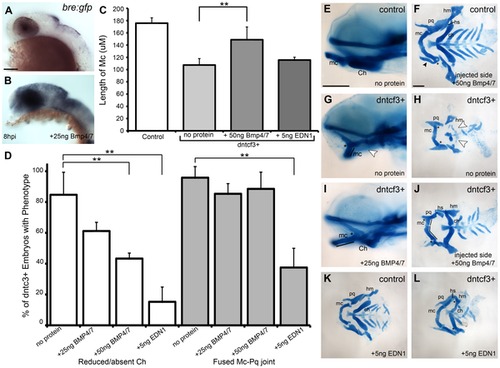
BMP protein rescues craniofacial phenotypes in dntcf+ embryos. (A,B) Whole mount ISH for gfp in Tg(Bre:gfp) embryos, lateral views, anterior to the left. (A) Wildtype and (B) following injection with 25 ng/embryo BMP4/7 into the arch region at 20 hpf. (C) Histogram quantifying Mc length (µM) in controls, dntcf3+ embryos, and dntcf3+ embryos injected with either 50 ng of BMP4/7 or 5 ng EDN1. (D) Histograms quantifying numbers of dntcf3+ embryos, alone or injected with BMP4/7 or EDN1 proteins, with reductions in Ch (left) and joint fusions between Mc and Pq (right). Numbers of embryos with rescue of Ch or Mc-Pq were averaged from three independent experiments (minimum of 10 embryos per protein injection experiment) and samples compared using a paired student t-test. (E, G, I) Whole mounted, alcian-stained 4 dpf larvae; control (E), dntcf3+ (G), and dntcf3+ injected with 25 ug BMP4/7 (I), lateral views, anterior to the left. Arrowhead in G indicates Ch loss. Black lines in G and I indicate Mc length and asterisks indicate Mc-Pq joint fusion. (F, H, J–L) Dissected, flat-mounted alcian-stained cartilages at 4 dpf, ventral views, anterior to the left; control with unilateral injection of 50 ng BMP4/7 (F), dntcf3+ (H), dntcf3+ with 25 ng BMP4/7 (J), control with 5 ng EDN1 (K) and dntcf3+ with 5 ng EDN1 (L). Arrowhead in F indicates duplicate Mc. Black lines in J indicate Mc length. Arrowheads in H indicate Sy and Ch. Asterisks in H, J and L indicate Mc-Pq joint fusions. **P<0.001. Abbreviations: Ch, ceratohyal; mc, Meckel′s; mc′, duplicated Meckel′s; Sy, symplectic. Scale bar: 100 µm. |
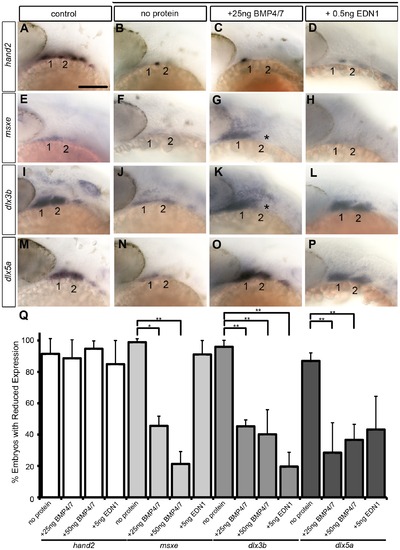
Bmp and Edn1 restore ventral-intermediate gene expression, but not hand2, in dntcf3+ embryos. (A–P) Whole mount ISH for ventral-intermediate patterning genes in heat shocked controls (A, E, I, M), dntcf3+ embryos (B, F, J, N), and dntcf3+ embryos with either 25 ng BMP4/7 (C, G, K, O), or 5 ng EDN1 (D, H, L, P), lateral views, anterior to the left. Asterisks in G and K indicate cases in which rescue occurred in arch 1 but not arch 2. (Q) Histogram quantifying the number of embryos with reductions in arch expression for each gene. Quantification obtained by counting number of embryos with rescue of gene expression in three independent experiments (minimum of 10 embryos per protein injection experiment). Statistical method used is a paired student t-test. * P<0.05, ** P<0.001. Scale bar: 100 µm. |
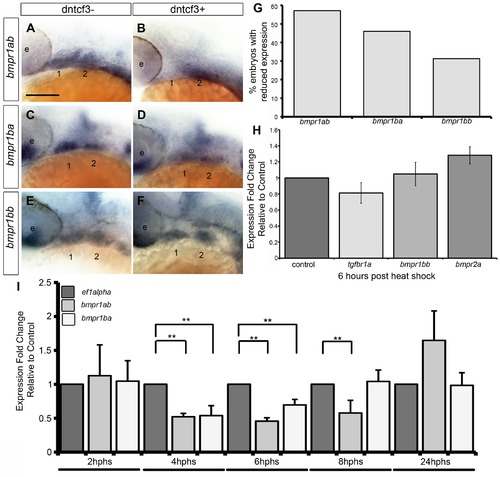
Bmp receptor expression in dntcf3+ embryos. (A–F) Whole mount ISH for bmpr1ab (A, B), bmpr1ba (C, D), and bmpr1bb (E, F) expression, lateral views, anterior to the left. (G) Histogram quantifying the number of dntcf3+ embryos with reduced expression. (H,I) qPCR analysis of Bmp receptor expression levels in dntcf3+ embryos at different times post heat shock, normalized to nontransgenic, heat-shocked controls, with ef1alpha as an internal control. * P<0.05, ** P<0.001. Abbreviations: e, eye; nc, neural crest. Scale bar: 100 µm. |
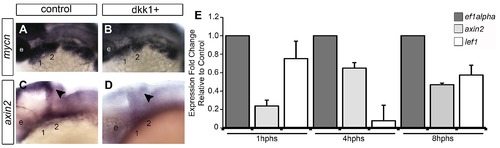
Wnt signaling defects in dkk1+ embryos. (A–D) Whole mount in situ hybridization (ISH) for mycn (A, B) and axin2 (C, D) expression in dkk1+ embryos at 24 hpf (2 hphs), lateral views, anterior to the left. Arrowheads indicate expression at the mid-hindbrain boundary. (E) Quantitative, real-time PCR (pPCR) analysis for axin2 (red bars) and lef1 (orange bars) in dkk1+ embryos, normalized to nontransgenic, heat-shocked controls, with ef1alpha as an internal control. Abbreviations: e, eye. |
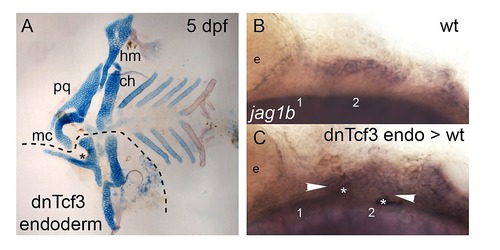
Wnt signaling in the pharyngeal endoderm is necessary for D-V arch patterning. (A) Dissected, flat mounted alcian blue/alizarin stained cartilage/bone at 5 dpf. Anterior to the left. Transplantation of dntcf3+ endoderm results in D-V patterning defects including reduced Mc, fused Mc-Pq, and loss of Hs. A dotted line indicates the extent of the endoderm transplant, which was lost in dissection. Asterisk indicates joint fusion. (B–C) Lateral views of in situ hybridization for jag1b in a control (B) and a mosaic embryo in which dntcf3+ cells were transplanted into the endoderm in WT hosts. White arrowheads indicate expansion of jag1b expression into the ventral domain of arches 1 and 2. Asterisks indicate transplanted, diaminobenzidine-stained donor cells. Abbreviations: Ch, ceratohyal; Hm, hyomandibular; Hs, hyosymplectic; Mc, Meckel′s; Pq, palatoquadrate. |
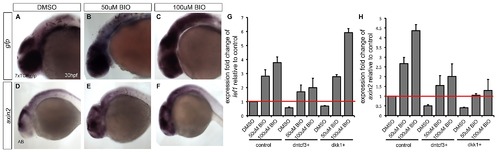
BIO rescues expression of Wnt targets in dntcf3+ and dkk1+ embryos. (A–F) Whole mount ISH for gfp (A–C) and axin2 (D–F) at 30 hpf in embryos treated with DMSO, 50 µM BIO, and 100 µM BIO for 6 hours at 24 hpf. With increasing concentrations of BIO, 7xTCF:GFP embryos show an increase in ectopic gfp expression, particularly throughout the brain (B,C), Similarly, axin2 expression expands in a dose-dependent manner (E,F). (G–H) qPCR analysis for Wnt targets lef1 (G) and axin2 (H) in control, dntcf3+, and dkk1+ embryos treated with DMSO, 50 µM BIO, and 100 µM BIO for 6 hours at 2 hphs. Red line indicates normalized expression levels in DMSO treated non-transgenic controls with ef1alpha as an internal control. BIO induces expression of Wnt targets in non-transgenic controls and rescues expression in dntcf3+ and dkk1+ embryos (G,H). |
BIO rescues D-V defects in dntcf3+ and dkk1+ embryos. (A–I) Dissected, flat mounted alcian-stained cartilage at 4 dpf, ventral views, anterior to the left; non-transgenic control (top row), dntcf3+ (middle row) and dkk1+ (bottom row), untreated (A, D, G), or treated with 50 µM (B, E, H) or 100 µM (C, F, I) BIO for 6 hours. White arrowheads in G-H indicate Mc clefting, and black arrowheads indicate missing Ch in D. Asterisks in D and G indicate Mc-Pq joint fusions. High concentrations of BIO reduce overall cartilage size and cause specific loss of dorsal cartilages (C). BIO treatments rescue Mc-Pq joint fusions in both dntcf3+ and dkk1+ embryos (E, F, H, I, M) as well as Ch in dntcf3+ embryos (E, F, M). High BIO concentrations rescue Mc clefting in dkk1+ embryos (I). (J–L) Whole mount ISH for pcna in control embryos treated with DMSO, 50 µM BIO, and 100 µM BIO. (M) Histogram quantifying the percentage of dntcf3+ embryos showing Ch loss or Mc-Pq joint fusion in response to BIO treatments. Abbreviations: Ch, ceratohyal; Hm, hyomandibular; Mc, Meckel′s; Pq, palatoquadrate. |
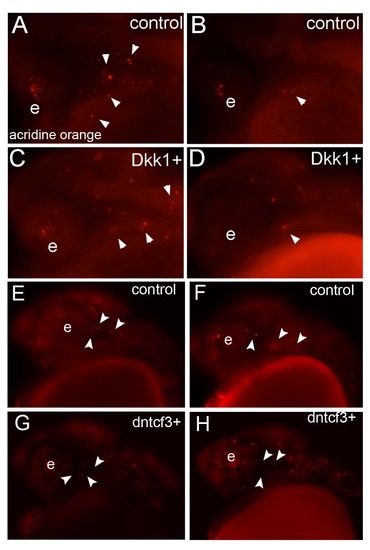
Cell death is not increased in dkk1+ and dntcf3+ embryos. (A–H) Lateral views of live acridine orange staining at 6 hphs in control (A, B, E, F), dkk1+ (C, D), and dntcf3+ (G, H) embryos. White arrowheads indicate apoptotic cells. Abbreviations: e, eye. |
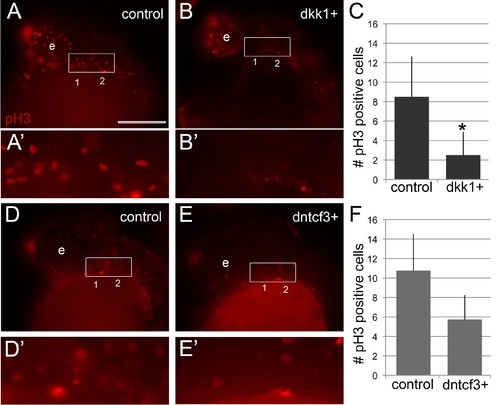
Arch proliferation defects in dkk1+ and dntcf3+ embryos. (A, B, D, E) Anti-phosphoHistone3 (pH 3) staining in controls (A, A′) and dkk1+ (B, B′) embryos stained 3 hphs and in controls (D, D′) and dntcf3+ (E, E′) embryos stained 4 hphs; lateral views, anterior to the left. (A′, B′, D′, E′). Enlargements of boxed areas encompassing presumptive first and second arches used for quantification. (C, F) Histograms quantifying numbers of pH 3 positive cells in the pharyngeal region of control and dkk1+ embryos, p<0.05 (C) and dntcf3+ embryos, p = 0.06 (F). Scale bar: 100 µm. |
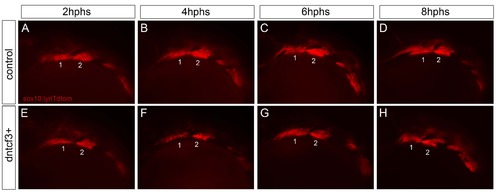
Neural crest migration in dntcf3+ embryos. (A–H) Live images of Tg(sox10:lyn-Tdtomato) fluorescence in cranial neural crest cells in the arches in control (A–D) and dntcf3+ (E–H) embryos at 2 hour intervals post heatshock, lateral views, anterior to the left. |
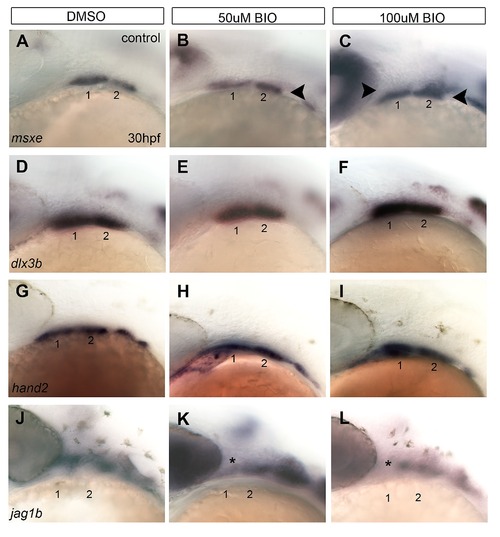
BIO disrupts dorsal-ventral patterning gene expression. (A–L) Lateral views of whole mount ISH for D-V patterning genes in embryos treated with DMSO (A, D, G, J), 50 µM BIO (B, E, H, K), and 100 µM BIO (C, F, I, L) for 6 hours at 24 hpf. With increasing concentrations of BIO, expression of the ventral-intermediate gene msxe expands dorsally (B, C) (black arrowheads). In response to BIO treatments, expression domains of hand2 (H–I) and dlx3b (E–F) only expand slightly. Expression of the dorsally restricted jag1b is reduced (asterisk) in the first and second arches of BIO treated embryos (K–L). |

Bmp receptor expression during pharyngeal arch development. (A–O) Whole mount ISH for bmpr1aa (A, B), bmpr1bb (C, D, O), bmpr1ab (E, F, M), bmpr2a (G, H), bmpr1ba (I, J, N), and bmpr2b (K, L), lateral views, anterior to the left. (P–R) Transverse sections through 24 hpf embryos showing expression of bmpr1ab (P), bmpr1ba (Q), and bmpr1bb (R) in neural crest cells of the pharyngeal arches. Arrowheads indicate ventral restriction of bmpr1ab (P) and bmpr1bb (Q) expression compared with bmpr1ab (R). Abbreviations: e, eye; hb, hindbrain; mhb, mid-hindbrain boundary; nc, notocord; nt, neural tube; pa, pharyngeal arches; s, somites. EXPRESSION / LABELING:
|
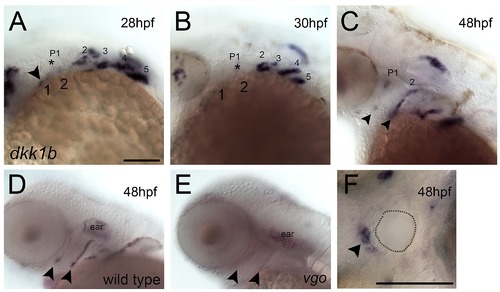
Dkk1 expression in pharyngeal endoderm. (A–F) Whole mount ISH for dkk1b in wild type (A–D, F) and van gogh (vgo) (E) embryos, (A–E) lateral and (F) ventral views, anterior to the left. Arrowhead in A indicates expression in the first arch. Asterisks in A and B indicate the first pharyngeal pouch. Arrowheads in C-E indicate the first and second pouches. (F) Ventral view at 48 hpf showing dkk1b expression in the oral ectoderm (arrowhead) surrounding the mouth opening (dotted line). Scale bar: 100 µm. |
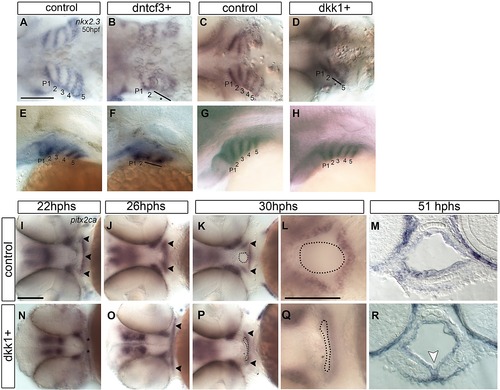
Defects in endoderm and oral ectoderm in dkk1+ embryos (A–L, N–Q) Whole mount ISH, anterior to the left. (A–H) Dorsal and lateral views showing nkx2.3 expression in pharyngeal pouch endoderm at 50 hpf in controls (A, C, E, G), dntcf3+ (B, F), and dkk1+ (D, H) embryos. Normal pouches are numbered. Asterisks and black lines indicate defective pouches. (I–L, N–Q) Ventral views showing pitx2ca expression in control (I–L) and dkk1+ (N–Q) embryos. (M, R) Transverse sections of the mouth showing pitx2ca expression in control (M) and dkk1+ (R) embryos at 51 hpf. Arrowheads indicate expression in oral ectoderm. Dotted lines in K, L, P and Q indicate the mouth opening. White arrowhead indicates a ventral midline fold in the mouth. Scale bars: 100 µm. EXPRESSION / LABELING:
PHENOTYPE:
|