
- Title
-
Smoc2 modulates embryonic myelopoiesis during zebrafish development
- Authors
- Mommaerts, H., Esguerra, C.V., Hartmann, U., Luyten, F.P., Tylzanowski, P.
- Source
- Full text @ Dev. Dyn.
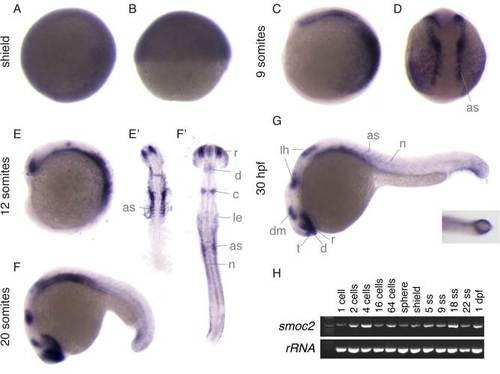
Expression analysis of smoc2. A–G: Expression pattern of smoc2 during the indicated stages of zebrafish development. From somitogenesis onward, transcripts were detected in anterior somites (as), anterior and ventral retina (r), dorsal diencephalon (d), telencephalon (t), dorsal midbrain (dm), lateral hindbrain (lh), cerebellum (c), lateral epidermis (le) and the notochord (n). H: RT-PCR analysis at indicated stages of development show smoc2 transcripts from early stages onward. |
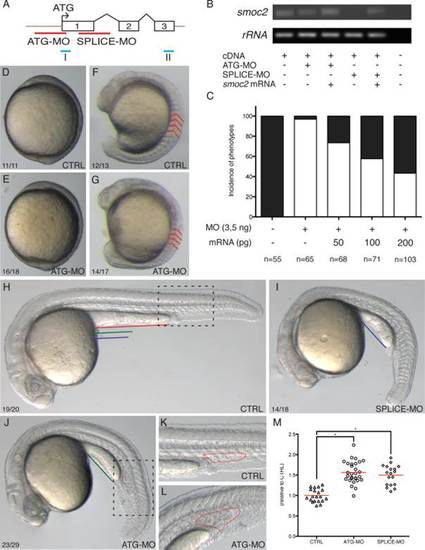
Morphological defects in smoc2 morphant zebrafish embryos. A: Diagram illustrating the design of the ATG-MO and the SPLICE-MO. B: RT-PCR at 24 hpf using primers I and II indicated in A. C: Dose response analysis after co-injecting smoc2 ATG-MO and smoc2 mRNA. D–L: Lateral view of control embryos (D,F,H,K) and smoc2 morphants (E,G,I,J,L) at bud stage (D,E; anterior to the top), 15 ss (F,G; anterior to the top) and at the onset of blood cell circulation (H–L; anterior to the left). smoc2 morphants showed a reduced axial length (F–J), loss of “v-shaped” somites (compare red lines in F and G), shortened yolk sac extension (compare colored lines in H–J), a downward curvature of the tail (H–J) and denser and enlarged blood islands (H–J and magnification of the dotted region in K and L). M: Quantification of the size of the PBI of control embryos (n = 20), ATG morphants (n = 29; *P < 0.05), and SPLICE morphants (n = 18; *P < 0.05). PHENOTYPE:
|
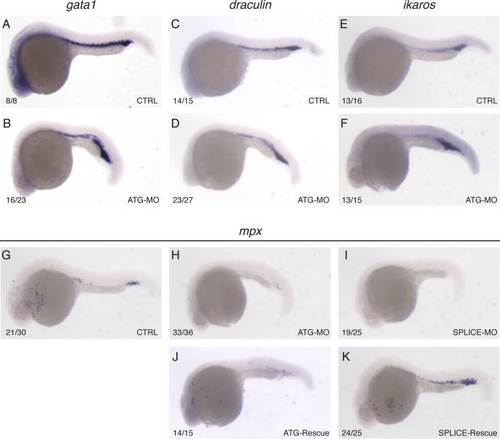
Molecular defects in smoc2 morphant zebrafish embryos. A–K: Lateral view of control embryos (A,C,E,G), smoc2 morphants (B,D,F,H,I) and rescue condition (J,K), dorsal to the top at the onset of blood cell circulation. WISH analysis for gata1 (A,B), draculin (C,D), ikaros (E,F), and mpx (G–K). EXPRESSION / LABELING:
|
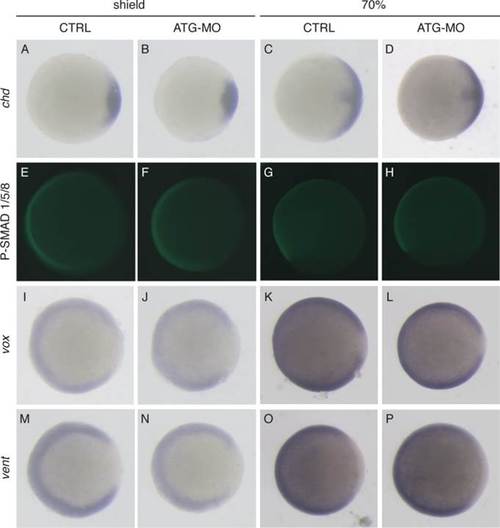
smoc2 morphants do not display early dorsoventral patterning defects. A–F, I–P: Animal view, dorsal to the right. G,H: Lateral view, dorsal to the right. A–D, I–L, M–P: WISH analysis for the extracellular Bmp inhibitor chd (A–D) and the Bmp target genes vox (I–L) and vent (M–P). E–H: Immunostaining for phosphorylated Smad1/5/8 proteins. EXPRESSION / LABELING:
|
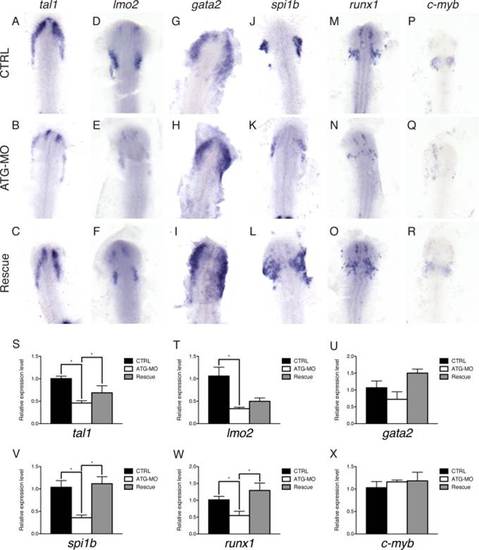
smoc2 morphants display defects in hematopoiesis at 12 ss. A–R: Dorsal view of anterior lateral plate mesoderm; anterior to the top. WISH analysis for tal1 (A–C), lmo2 (D–F), gata2 (G–I), spi1b (J–L), runx1 (M–O), and c-myb (P–R) of control embryos, ATG morphants and rescue embryos at 12 ss (n e 12). S–X: Quantification of changes in expression levels by qPCR. Values plotted as mean ±SEM; n≥4; *P<0.05. EXPRESSION / LABELING:
PHENOTYPE:
|
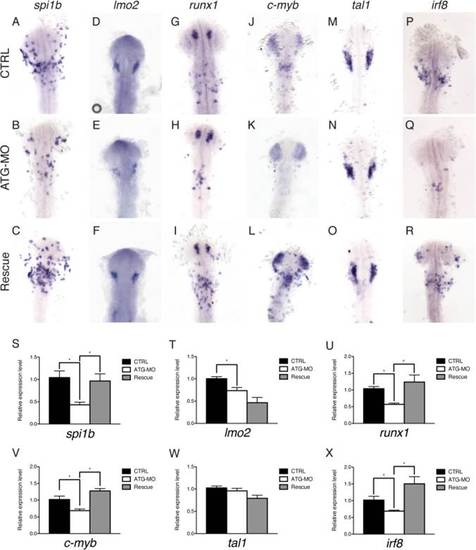
smoc2 morphants display defects in hematopoiesis at 18 ss. A–R: Dorsal view of anterior lateral plate mesoderm; anterior to the top. WISH analysis for spi1b (A–C), lmo2 (D–F), runx1 (G–I), c-myb (J–L), tal1 (M–O), and irf8 (P–R) of control embryos, ATG morphants and rescue embryos at 18 ss (n e 11). S–X: Quantification of changes in expression levels by qPCR. Values plotted as mean ± SEM; n ≥ 4; *P < 0.05. EXPRESSION / LABELING:
PHENOTYPE:
|
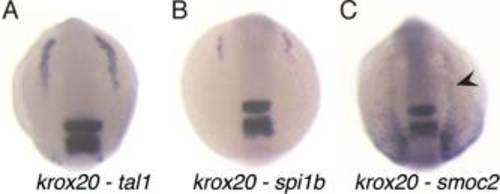
Expression pattern of smoc2 in relation to tal1 and spi1b. A–C: Dorsal view, anterior to the top at 5ss. Dual WISH for tal1 (A), spi1b (B), and smoc2 (C) with krox20, the marker for rhombomere 3 and 5 (n ≥ 20). EXPRESSION / LABELING:
|
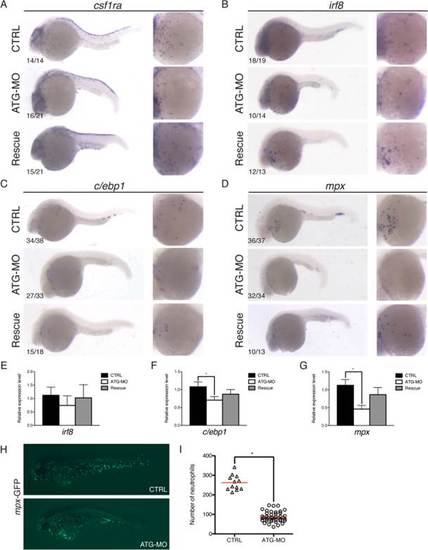
smoc2 morphants display defects in embryonic myelopoiesis at the onset of blood circulation. A–D: Lateral views of the embryos, anterior to the left, dorsal to the top, at the onset of circulation. A: WISH analysis or the macrophage markers csf1ra (A) and irf8 (B), and the neutrophil markers c/ebp1 (C) and mpx (D). E–G: qPCR analysis for irf8 (E), c/ebp1 (F) and mpx (G). Values plotted as mean ± SEM; n = 4; *P < 0.05. H,I: Visualization of the mpx-positive cells using the mpx reporter embryos (Tg(mpx:GFP)i114) at 3 dpf (H) and the quantification of the number of neutrophils in the ATG morphants (n = 42) as compared to the control embryos (n = 12; *P < 0.05) (I). EXPRESSION / LABELING:
PHENOTYPE:
|
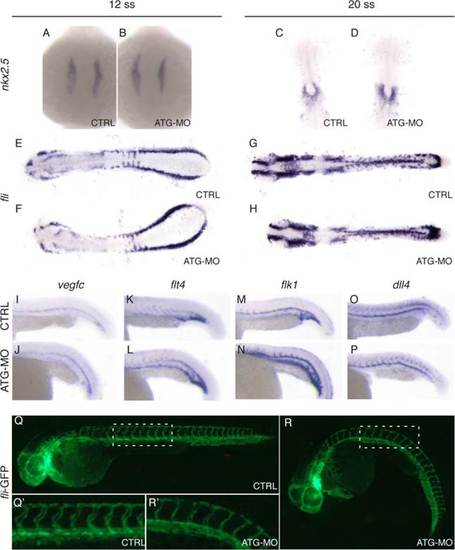
smoc2 morphants do not display cardiovascular defects. Dorsal (A–D: anterior to the top; E–H: anterior to the left) and lateral view (I–R′ anterior to the left) of embryos at 12 ss (A,B,E,F), 20 ss (C,D,G,H), the onset of blood cell circulation (I–P) and 50 hpf (Q,R′). Analysis of the expression pattern of the early cardiac marker nkx2.5 (A–D), the vascular marker fli (E–H), the dorsal aorta marker vegfc (I,J), the marker for all venous and arterial cells flt4 (K,L), the endothelial marker flk1 (M,N) and the arterial marker dll4 (O,P) (n ≥ 14). Q–R′: Visualization of the fli-positive vasculature using the (Tg(fli:eGFP)y1) reporter fish at 50 hpf. EXPRESSION / LABELING:
|
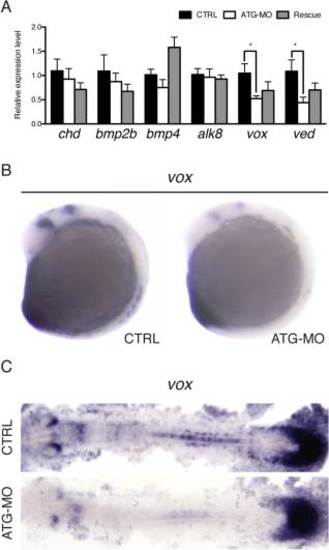
smoc2 modulates Bmp signaling in the ALPM at 12 ss. A: qPCR analysis of the effect of the reduction of smoc2 levels on the expression of members of the Bmp signaling cascade (chd, bmp2b, bmp4, alk8, vox, and ved) in the ALPM. Values plotted as mean ± SEM; n = 4; *P < 0.05. B: Lateral view, anterior to the top; 12 ss. WISH analysis of the expression pattern of vox mRNA (n ≥ 25). C: Dorsal view, anterior to the left. WISH analysis of the expression of vox mRNA. EXPRESSION / LABELING:
PHENOTYPE:
|