
- Title
-
Telomere distribution pattern and synapsis initiation during spermatogenesis in zebrafish
- Authors
- Saito, K., Sakai, C., Kawasaki, T., Sakai, N.
- Source
- Full text @ Dev. Dyn.

FISH using a Cy3-conjugated (CCCTAA)3 PNA telomere probe in metaphase cells and pachytene spermatocytes. A–C: FISH using a telomere probe in metaphase chromosomes prepared from the cells of a 1-day-old zebrafish embryo. Panel A shows FISH signals, panel B shows nuclear staining with TO-PRO-3, and panel C shows a merged image of panels A and B. More than 90% of telomeres were clearly detected. D–F: FISH using a telomere probe in combination with immunocytochemical labeling of Sycp3 in pachytene spermatocyte spreads. Panel D shows FISH signals, panel E shows Sycp3 signals, and panel F shows a merged image of panels D and E. Telomere signals were detected at both ends of Sycp3-positive structures. Scale bars = 10 µm. EXPRESSION / LABELING:
|
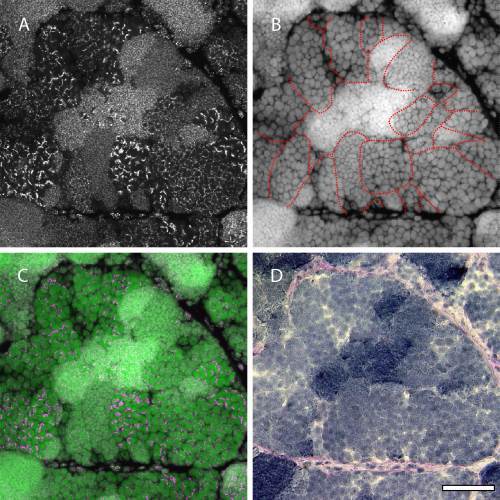
Overall image of FISH signals using a telomere probe in zebrafish testis. A–C: FISH using a telomere probe in cryosections of a sexually mature testis. Panel A shows FISH signals, panel B shows nuclear staining with TO-PRO-3, and panel C shows a merged image of panels A and B. D: Same area viewed in panels A–C stained with periodic acid–Schiff (PAS) and hematoxylin. Zebrafish germ cells develop synchronously within each cyst (outlined in panel B). These cysts are formed by Sertoli cells in the tubular basement membrane, which is stained by PAS. Telomeres in the germ cells exhibit different patterns in each cyst. Scale bar = 50 µm. |
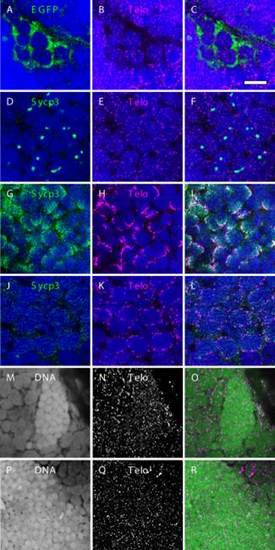
Distribution and assembly of telomeres in zebrafish spermatogenic cells. A–C: Telomeres in spermatogonia. Spermatogonia were identified by EGFP expression in vas::EGFP transgenic zebrafish testis. Panel A shows anti-GFP antibody staining (green), panel B shows FISH signals using a telomere probe (magenta), and panel C shows a merged image of panels A and B. D–L: Telomeres in meiotic spermatocytes. Spermatocytes at preleptotene (D–F), leptotene or early zygotene (G–I), and pachytene (J–L) stages were identified according to their Sycp3 expression patterns. Panels D, G, and J show anti-Sycp3 antibody staining (green); panels E, H, and K show FISH signals using a telomere probe (magenta); and panels F, I, and L show merged images. Nuclei were stained with TO-PRO-3 and are displayed in blue (A–L). M–R: Distributions of telomeres in spermatids (M–O) and sperm (P–R). Panels M and P show nuclear staining with TO-PRO-3, panels N and Q show FISH signals using a telomere probe, and panels O and R show merged images (TO-PRO-3, green; FISH signal, magenta). Scale bar = 10 µm. EXPRESSION / LABELING:
|

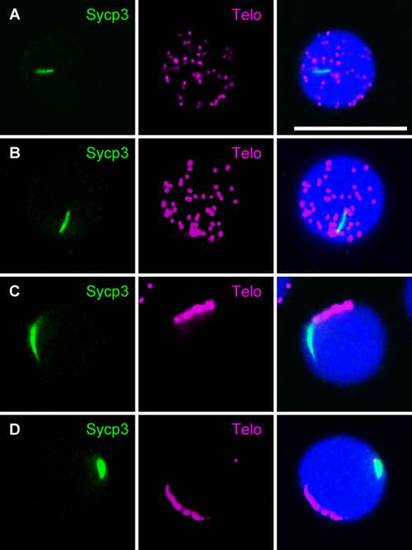
Analysis of the dynamics of meiotic telomeres in zebrafish by performing FISH using a telomere probe in combination with immunocytochemical labeling of Sycp3. Telomeres were analyzed in chromosome spreads of spermatocytes isolated from adult testis. A–E: Immunocytochemical labeling of Sycp3 in combination with FISH using a telomere probe in spermatocytes at preleptotene (A), early leptotene (B), early zygotene (C), zygotene (D), and pachytene (E) stages. Left panels show Sycp3 staining (green), middle panels show FISH signals (magenta), and right panels show merged images of the left and middle panels. Nuclei were stained with TO-PRO-3 (blue). F,G: Three-dimensional analysis of meiotic cells. Serial optical sections were obtained using confocal laser microscopy, and 3D images were reconstructed using software attached to the microscope after double staining of Sycp3 and telomeres in spermatocytes at leptotene (F) and zygotene (G) stages. Left panels show representative examples of single plane images obtained from the serial sections. Sycp3 and telomere signals are displayed in green and magenta, respectively. Middle and right panels show axial and lateral views, respectively, of the 3D reconstructed images. Telomere signals and nuclear staining are displayed in magenta and green, respectively. In the right panels, the surface of the glass slide is represented by a white dashed line. Bars = 10 µm. EXPRESSION / LABELING:
|

Immunocytochemical analyses of Sycp1 and Sycp3 in primary spermatocytes. Localization of Sycp1 (A–E), Sycp3 (F–J), merged Sycp1 and Sycp3 staining (K–O), and merged Sycp1, Sycp3, and nuclear staining with TO-PRO-3 (P–T) are shown at the preleptotene (A,F,K,P), early leptotene (B,G,L,Q), early zygotene (C,H,N,R), zygotene (D,I,M,S), and pachytene (E,J,O,T) stages. Each developmental stage of spermatocytes was identified according to their synaptonemal complex (SC) structures. Bar = 10 µm. EXPRESSION / LABELING:
|

Localizations of α-tubulin and γ-tubulin in spermatocytes. A: FISH using a telomere probe in combination with immunocytochemical labeling of γ-tubulin. B: FISH using a telomere probe in combination with immunocytochemical labeling of α-tubulin. C,D: Double immunocytochemical labeling of α-tubulin and Sycp3 at the early zygotene (C) and zygotene (D) stages. α-Tubulin staining expands during the zygotene stage. Left panels show telomere or Sycp3 staining (magenta), middle panels show γ-tubulin or α-tubulin staining (green), and right panels show merged images of the left and middle panels. Nuclei were stained with TO-PRO-3 (blue). Scale bar = 10 µm. EXPRESSION / LABELING:
|
Analysis of the distribution of telomeres by performing FISH using a telomere probe in combination with immunocytochemical labeling of Sycp3 in spermatocytes of the its zebrafish mutant. A: Nucleus of a preleptotene spermatocyte from a wild-type zebrafish exhibits one intranuclear Sycp3 aggregate. B: Telomeres are dispersed throughout the nucleus of a preleptotene spermatocyte from an its mutant zebrafish, similar to the wild-type preleptotene spermatocyte (A). C,D: Another spermatocyte from an its mutant zebrafish exhibits aggregated Sycp3 and is most likely at a preleptotene-equivalent stage, while telomeres are restricted to a small region of the nuclear periphery. In panel C, telomeres are close to Sycp3, whereas in panel D, they are not. Left panels show Sycp3 staining (green), middle panels show FISH signals (magenta), and right panels show merged images of the left and middle panels. Nuclei were stained with TO-PRO-3 (blue). Scale bar = 10 µm. These images are representative of 20 nuclei analyzed at each stage per specimen (n = 3). EXPRESSION / LABELING:
|
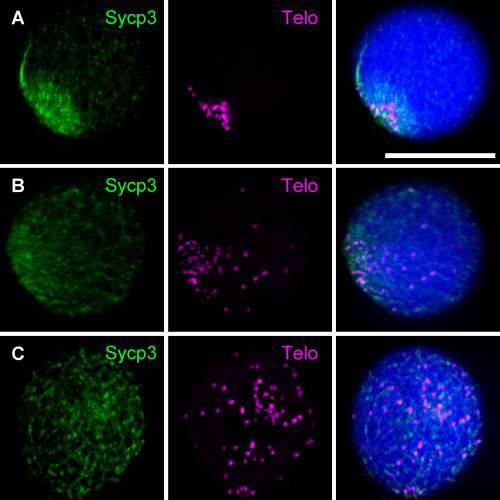
Analysis of the distribution of telomeres by performing FISH using a telomere probe in combination with immunocytochemical labeling of Sycp3 in spermatocytes of the imo zebrafish mutant. FISH and labeling of Sycp3 were performed in the imo spermatocytes at leptotene (A), early zygotene (B), and zygotene (C) stages. A: Telomeres localize within a small region of the nuclear periphery and form a bouquet configuration at the leptotene stage. B: At the early zygotene stage, telomeres start to move over the nuclear periphery. C: Telomeres disperse over the nuclear periphery at the zygotene stage. Left panels show Sycp3 staining (green), middle panels show FISH signals (magenta), and right panels show merged images of the left and middle panels. Nuclei were stained with TO-PRO-3 (blue). Scale bar = 10 µm. These images are representative of 20 nuclei analyzed at each stage per specimen (n = 3). EXPRESSION / LABELING:
|