
- Title
-
Dissecting the differentiation process of the pre-placodal ectoderm in zebrafish
- Authors
- Yao, D., Zhao, F., Wu, Y., Wang, J., Wei, D., Zhao, J., Zhu, Z., Liu, D.
- Source
- Full text @ Dev. Dyn.

At the shield stage, the PPR cells have distinct preference to adopt the otic fate along the A-P axis. A: A diagram of animal pole view of a shield stage embryo (6 hpf) (adopted from Streit, Kozlowski et al., 1997). It illustrates the neural ectoderm (grey shaded area), the preplacodal region (the partially overlapped color-areas between two black lines), which could be presumptively called the PPR and pointed by an arrow, and the belly ectoderm (pink shaded area). The red arrow indicates where Fgf8 soaked beads (circled asterisks) are implanted. Cells of the colored areas give rise to distinct placodal fates (indicated in A). B: An Fgf8 bead is implanted in the presumptive PPR. Arrowhead indicates the shield. The scale bar does not apply. C: An Fgf8 bead implanted into the presumptive PPR (intermediate) induces ectopic ear (blue arrow) as indicated by cldna expression. A black arrow indicates the endogenous ear. D: The endogenous ear fails to form in an fgf8-/- mutant injected with fgf3MO (black arrow), but implantation of an Fgf8 bead induces an ectopic ear (blue arrow in the inlet) in the intermediate PPR. E: Ectopic ear (blue arrow) is induced caudally to the endogenous ear (black arrow) by an Fgf8 bead implanted in the posterior PPR. F: Percentage of Fgf8-beads that induce ectopic ears in the anterior (beads anterior to endogenous eyes, aPPR), intermediate (beads between endogenous eyes and ears, iPPR) and posterior (beads caudal to endogenous ears, pPPR) implants. G: An Fgf8 bead implanted just outside the presumptive PPR induces a pair of ectopic ears (blue arrows). One of the ectopic ears is seen fused to the endogenous ear (black arrow). H: An Fgf8 bead implanted in the anterior neural ectoderm fails to induce any cldna expression. The black arrow points to the endogenous otic placode. Unless indicated at the lower left corner of each panel, all are the wild-type embryos. A,B: Animal pole views. C–E and G,H: Side views with anterior to the left. A,B: 6 hpf; C: 36 hpf; D–G: 24 hpf; H: 14.5 hpf. Scale bar = 200 µm in D,E, G,H; 50 µm in C. |
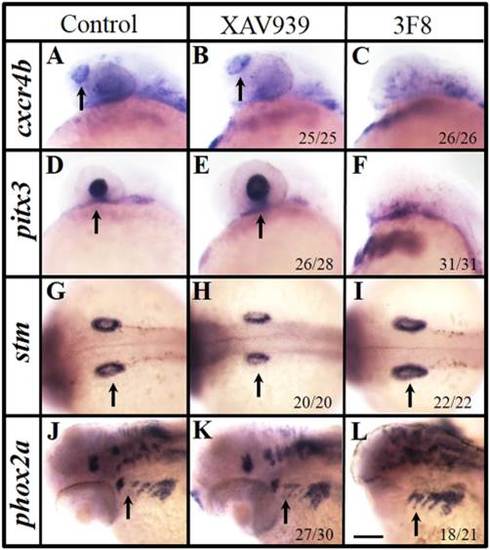
Modulating Wnt signaling around the shield stage alters the development of PPR-derived placodes. A–F: Marker gene expression changes in the rostral PPR-derived placodes of treated embryos. The XAV939 treatment (5–7 hpf) enlarges the olfactory cxcr4b expression (B) and lens pitx3 expression (E), compared with those in control embryos (A,D). The 3F8 treatment (5–7 hpf) leads to no olfactory cxcr4b (C) and lens pitx3 expression (F). G–L: Changes in the caudal PPR-derived placodal marker gene expression in treated embryos. The XAV939 treatment (5–7 hpf) reduces the otic stm (H) or does not change the epibranchial phox2a expression (K), compared with those of controls (G,J). The 3F8 treatment (5–7 hpf) results in larger otic stm (I) and stronger epibranchial phox2a expression (L). Arrows indicate the corresponding organ or organ primordium of each embryo. A–F, J–L: Side views with anterior to the left; G–I: Dorsal views with anterior to the left. A–I: 24 hpf; J–L: 48 hpf. Scale bar = 100 µm. |

Modulation of Wnt signaling affects the PPR polarity and OEPD development also regulates gata3 and foxi1 expression. A–C: XAV939 treated (5–7 hpf) embryos show enhanced yet loosely packed PPR six4.1 expression (B), compared with the control (A). 3F8 (5–7 hpf) treatment enhances six4.1 expression in caudal PPR and a reduction at the anterior most region (C). D–F: foxi1 expression domains are reduced after XAV939 treatment (E), compared with the control (D). 3F8 (5–7 hpf) treatment anteriorly expands foxi1 expression and the bilateral expression domains are fused rostrally (F). G–I: gata3 expressions are enhanced by XAV939 treatment (H) and reduced after 3F8 treatment (I), compared with control (G). J–L: The OEPD but mid-hindbrain boundary (MHB) expression of pax2a is reduced in embryos treated by XAV939 (K), compared with the control (J). 3F8 (5–7 hpf) treatment expands both MHB and OEPD pax2a expression rostra-caudally (L). 12 hpf. Black arrows indicate the OEPD while blue triangles point to the MHB pax2a. M: Real-time RT-PCR reveals that modulating Wnt signaling adjusts foxi1 and gata3 expression levels at 10.5 hpf. Treating embryos with 3F8 at 5–7 hpf increases foxi1 but reduces gata3 expression. On the other hand, the XAV939 treatment of 5–7 hpf enhances gata3 but cuts down foxi1 expression. 10.5 hpf. *P < 0.05; **P < 0.01 ***P < 0.001 (ANOVA test). N: Different from 10.5 hpf, real-time RT-PCR reveals that modulating Wnt signaling adjusts only gata3 expression levels at 8 hpf. Treating embryos with 3F8 at 5–7 hpf reduces gata3 expression. On the other hand, the XAV939 treatment during 5–7 hpf enhances gata3 expression. 8 hpf. **P < 0.01; ***P < 0.001 (ANOVA test). A–L: Dorsal views with anterior to the left. A–C: 11 hpf; D–I: 10.5 hpf; J–L: 12 hpf. Scale bar = 200 µm. EXPRESSION / LABELING:
PHENOTYPE:
|
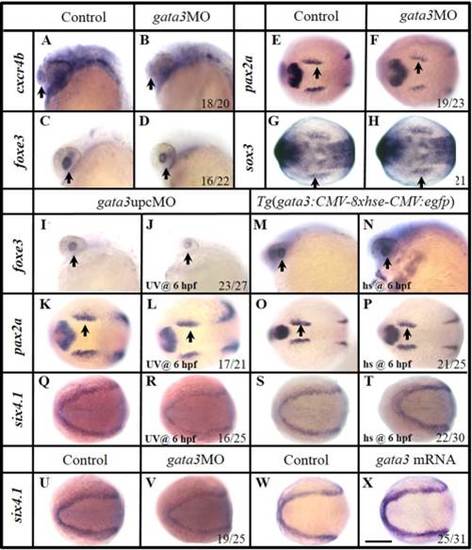
Manipulation of Gata3 mainly changes the development of rostral PPR. A–H: In gata3 morphants, reduced olfactory cxcr4b (B) and lens foxe3 (D) are observed compared with controls (A,C). Slightly reduced otic primordial pax2a (F) and epibranchial primordial sox3 (H) expressions are observed compared with their corresponding controls (E,G). I–L: Knocking down gata3 function with an upcMO at 6 hpf, the lens foxe3 (J) is slightly smaller than that of control (I). The OEPD pax2a is essentially unchanged (K,L). Embryos are injected with double-stranded MO at one-cell stage and cleaved by UV light at 6 hpf. M–P: Mis-expression of gata3 by heat shocking a transgenic line Tg(gfp:hse:gata3) at 6 hpf expands the lens foxe3 (N), but not the OEPD pax2a (P), compared with their controls (M,O). Q,R: Expression of six4.1 is reduced when Gata3 function is knocked down using upcMO. Embryos are injected at one-cell stage and treated by UV light at 6 hpf. S,T: Over expression of gata3 by heat shocking a transgenic line Tg(gfp:hse:gata3) at 6 hpf enhances six4.1 expression. U,V: Knocking down Gata3 function reduces the PPR six4.1 expression. W,X: Over expression of gata3 by mRNA injection enhances the PPR six4.1. A–D, I–J, and M–N: Side views with anterior to the left; E–H, K–L, and O–X: Dorsal views with anterior to the left. A–D, I–J, and M–N: 24 hpf; E–F and K–J: 12 hpf; G–H, Q–X: 11 hpf; O–P 12.5 hpf. Scale bar = 200 µm. EXPRESSION / LABELING:
PHENOTYPE:
|

Foxi1 and Gata3 are involved in PPR differentiation regulation after 6 hpf. A–F: Knocking down Gata3 function can restore the enlarged cxcr4b (B,C) and pitx3 (E,F) expression domains caused by the XAV939 (5–7 hpf) treatment, compared with those of control embryos (A,D). Double-stranded MO (gata3MO::gata3upcMO) is injected at the one-cell stage and cleaved by UV light at 6 hpf. G–L: Knocking down Foxi1 function can restore the enlarged pax2a (H,I) and sox3 (K,L) expression domains caused by the 3F8 (5–7 hpf) treatment, compared with those of control embryos (G,J). Double-stranded MO (foxi1MO::foxi1upcMO) is injected at the one-cell stage and cleaved by UV light at 6 hpf. Arrows indicate a corresponding organ or organ primordium of each embryo. A–F: Side views with anterior to the left; G–L: Dorsal views with anterior to the left. A–F: 24 hpf; G–I: 12 hpf; J–L: 11 hpf. Scale bar = 120 µm in A–F; 200 µm in G–L. EXPRESSION / LABELING:
PHENOTYPE:
|
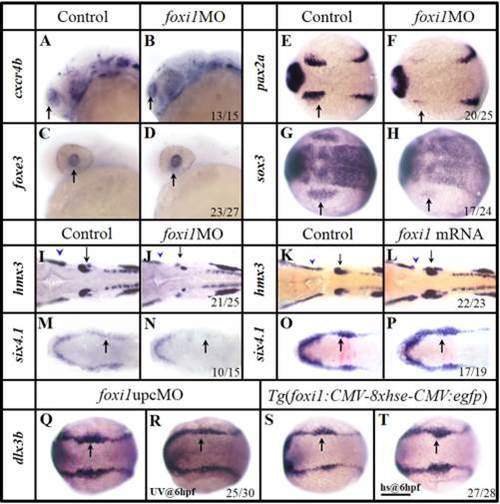
Foxi1 is specifically involved in the OEPD development. A–H: In foxi1 morphants, the olfactory (B) and lens (D) expression are unchanged, compared with their corresponding controls (A,C). The otic primordial pax2a (F) and epibranchial primordial sox3 (H) are severely reduced, compared with their corresponding controls (E, G). I,J: Smaller lateral line placode (blue arrowhead) and otic vesicle (black arrow) develop in foxi1MO embryos (J), compared with the control (I). K,L: The otic vesicles (black arrow) and lateral line placode (blue arrowhead) are enlarged when excess foxi1 mRNA (L) is present, compared with the control (K). M,N: foxi1MO injection results in the compromised caudal PPR six4.1. O,P: Over expression of foxi1 by mRNA injection enhances the OEPD dlx3b. Q,R: Expression of dlx3b is reduced caudally (in OEPD, black arrow) when Foxi1 function is knocked down by an upcMO activated by UV light at 6 hpf. S,T: Over expression of foxi1 by heat shocking a transgenic line Tg(gfp:hse:foxi1) at 6 hpf expands the caudal dlx3b expression (black arrow). A–D: Side views with anterior to the left; E–T: Dorsal views with anterior to the left. A–D and I–J: 24 hpf; E–F:12 hpf; G–H and M–T: 11 hpf; K,L: 26 hpf. Scale bar = 200 µm. EXPRESSION / LABELING:
PHENOTYPE:
|
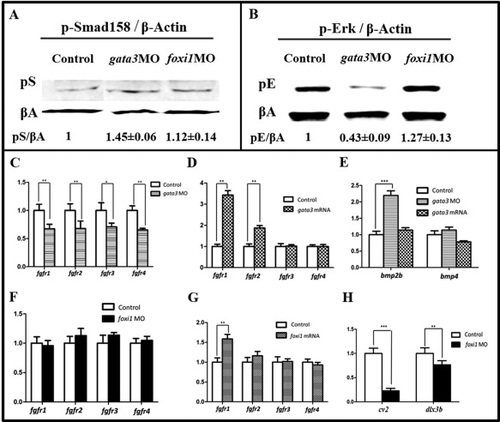
Gata3 and Foxi1 differentially regulate Fgf and Bmp signaling. A: Western blot analysis of the pSmad1/5/8 level of whole embryo (10 hpf). Both foxi1MO and gata3MO embryos show an increased p-Smad level (middle and right lanes), compared with that of control (left). The changes (mean value±error) are normalized against β-Actin level of each lane. B: Western blot analysis of p-Erk level of morphants (10 hpf). The foxi1MO embryos show an increase (middle lane) but gata3MO a decrease of p-Erk (right lane), compared with that of control (left lane). The changes (mean value±error) are normalized against β-Actin level of each lane. C: Real time-PCR tests show that in gata3 morphants, all fgfr gene expressions are down regulated at 10.5 hpf. *P < 0.05; **P < 0.01 (ANOVA test). D: Over-expressing gata3 leads to the up regulated fgfr1 and fgfr2 only. 10.5 hpf. **P < 0.01 (ANOVA test). E: Real time-PCR test shows that in gata3 morphants, only bmp2b is up regulated. 10.5 hpf. ***P < 0.001 (ANOVA test). F: Real time-PCR tests show that in foxi1 morphant, all fgfr expressions are not significantly changed. 10.5 hpf. G: Over-expressing foxi1 slightly up regulates fgfr1. **P < 0.01 (ANOVA test). 10.5 hpf. H: Real time-PCR test shows that Foxi1 regulates Bmp through cv2 and/or dlx3b. 10.5 hpf. **P < 0.01; ***P < 0.001 (ANOVA test). EXPRESSION / LABELING:
PHENOTYPE:
|