
- Title
-
Souffle/Spastizin Controls Secretory Vesicle Maturation during Zebrafish Oogenesis
- Authors
- Kanagaraj, P., Gautier-Stein, A., Riedel, D., Schomburg, C., Cerdà, J., Vollack, N., Dosch, R.
- Source
- Full text @ PLoS Genet.
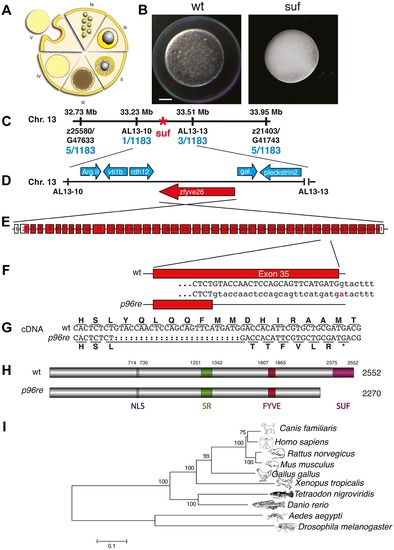
Molecular identification of the suf locus. (A) Diagram of zebrafish oogenesis represented as a composite of wedges displaying a single stage [11]. Oocytes are not drawn to scale and in the ovary, stages are mixed. Ia: 7–20 μm diameter of the oocyte; oocytes are still connected forming oogonia after the last mitosis. Ib: 20–140 μm, oocytes are separated by a layer of follicle cells (dashed red-yellow line) and several nucleoli appear in the nucleus (grey). II: 140–340 μm, formation of cortical granules is initiated (white vesicles). III: 340–690 μm, massive accumulation of yolk globules (brown vesicles) during vitellogenesis covering the germinal vesicle (oocyte nucleus). IV: 690–730 μm, oocytes are transformed into a fertilizable egg by meiotic maturation inducing germinal-vesicle-break-down. Simultaneously, the cytoplasm becomes transparent by yolk protein cleavage. V: 730–750 μm, eggs are released from the follicle layer of the ovary during ovulation into the oviduct. (B) Stage V oocytes 10 min after activation from heterozygous wild-type (wt; left panel) and mutant mothers (suf; right panel) showing the opaque cytoplasm and the chorion elevation defect in the mutant. Scale bar: 100 μm. (C) Genetic map of the suf-locus on chromosome 13. Meiotic mapping located the mutation between the markers z25580/G47633 (0.4 cM, centiMorgan; 5 recombinants/1183 females) and z21403/G41743 (0.4 cM) corresponding to a physical interval of 1.22 Mb (megabases). Fine mapping of the suf-locus identified markers AL13-10 (0.08 cM) and AL13-13 (0.2 cM), which physically represents 280 kB. (D) Among other genes, this interval contains the ArgII, vti1b, rdh12, galectin and pleckstrin2 genes, whose cDNA sequence did not display mutations in comparison to the database genome (http://www.ensembl.org/Danio_rerio/Info/ Index). (E) Exon-intron structure of the suf gene. (F) The p96re allele carries a G-A transition at the genomic level destroying a splice donor site in the transcribed RNA. (G) The selection of an alternative, upstream splice donor leads to a deletion of 25 nucleotides causing a frameshift in the cDNA encoding six aberrant amino acids and eventually creating a premature STOP-codon (asterisk). (H) The mutant protein is predicted to lack 282 amino acids at the C-terminus including the conserved SUF domain from amino acid 2375 to 2552. (I) Phylogenetic diagram displaying the conservation of Souffle proteins among vertebrates. The Anopheles and Drosophila proteins were used to root the tree. Numbers indicate bootstrap-values and the scale the number of substitutions per amino acid residue. PHENOTYPE:
|

Suf/Spastizin expression analysis. (A) Real-time PCR of suf/spastizin (red) and gdf9 (grey) mRNA during oogenesis relative to expression in the one-cell embryo normalized to gapdh and odc1 mRNA. Gdf9 is exclusively expressed in germ cells, which acts as a positive control for the purification of oocytes particularly in stage Ib oocytes, which are frequently contaminated with somatic follicle cells [111]. (B) suf/spastizin mRNA levels during embryogenesis, (C) in sexually mature adults, (D) and ovaries of different genotypes. (E) Conventional RT-PCR showing the expression of exon 34–36 (610 bp) of suf/spastizin mRNA at selected stages (h: hours post fertilization; d: days post fertilization). A lack of exon 35 is predicted to amplify a 413 bp product, which is not observed at any stage of oogenesis or embryogenesis. A longer run of this gel highlighting the 25 bp shorter transcript caused by the change of the splice donor in the mutant controls is shown in Figure S2. (F) Confocal section of wild-type (wt) and mutant (suf) stage III oocytes labeled with Suf/Spastizin antibody (green) and counterstained with lysotracker (red). Scale bar: 50 µm. Inset in wt panel shows the architecture of the oocyte cortex with the cytoplasm of the oocyte (yellow) forming microvilli crossing the acellular chorion membrane (CM; grey). The oocyte is surrounded by a layer of follicle cells (FC; green) [modified after 94]. |

Comparison of endosomal compartments in wild-type and suf/spastizin mutant oocytes. Small icon next to figures indicates the level of the optical section (black line) in the oocyte (blue circle). (A) Surface view of immuno-labeled stage III oocytes showing Rab5, Rab7 and Rab11 (green). The nuclei of the surrounding follicle cells are labeled with DAPI (blue). Note that Rab11-positive staining accumulates in patches below the layer of follicle cell nuclei. Scale bar: 50 μm. (B) Optical section of stage III oocytes showing no change in the number of Rab5, a slight increase of Rab7 and a strong increase of Rab11 positive vesicles. The oocyte cytoplasm was counterstained with the lysosomal marker Lysotracker (red) labeling yolk globules. Scale bar: 50 μm. (C) Summary of the results of panel B quantified in Figure S3. The bars display the ratio of Rab-positive foci in mutant oocytes to wild-type. Equal numbers correspond to one fold (baseline). (D) Functional analysis of the endosomal trafficking routes by cargo assay. LDL (red) as a marker for the degradative route accumulates within 10 min in fragmented lysosomes. Transferrin (Tfn; red) as a recycling cargo shows no difference between wt and mutant oocytes after 35 (middle) or 55 min (lower panel) pulse/chase. Note that Transferrin accumulates in a Rab11b-negative compartment. Scale bar: 50 μm. (E) In wt oocytes, Rab5 (green; upper panel) colocalizes with Suf/Spastizin (red), but Rab7 does not overlap (middle panel). Suf/Spastizin (red) and Rab11b (green) colocalize predominantly, but independent localization of Rab11 and Suf is also observed (lower panel). Scale bar: 50 μm. EXPRESSION / LABELING:
|
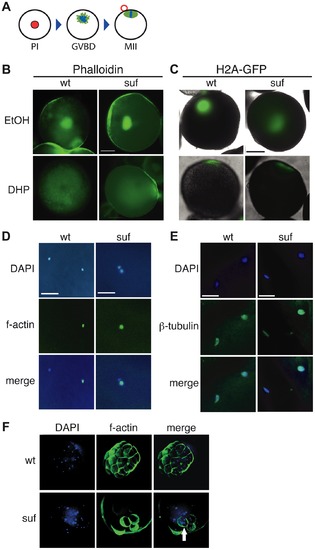
Suf is not essential for meiosis, but mitosis. (A) Steps of meiotic maturation. Zebrafish oocytes are arrested in prophase I (PI) of the first meiotic cell cycle indicated by the huge germinal vesicle (red). Maturation initiates with germinal vesicle breakdown (GVBD) and the first meiosis leads to the formation of a polar body (red circle). The egg arrests again in metaphase of the second meiotic cell cycle (MII), ready to be fertilized. (B) Stage III oocytes treated with carrier (EtOH) or maturation-inducing hormone (DHP). The germinal vesicle is highlighted with Phalloidin (green) showing no difference between wt and mutant. Scale bar: 100 μm. (C) Living stage III oocytes from wt and suf/spastizin mothers treated with carrier or DHP. The chromatin is highlighted by a Histon2A-GFP transgene (green) showing that GVBD occurs at the same time in mutant oocytes as in wt, whereas the cytoplasm stays opaque in suf/spastizin oocytes. Scale bar: 100 μm (D) suf/spastizin oocytes form a polar body. In vitro matured oocytes from wt and mutants stained with DAPI (blue) to highlight the nuclei and f-actin (green) to mark the polar body. Scale bar: 25 μm. (E) suf/spastizin oocytes arrest in metaphase II. Confocal images of β-tubulin (green) highlight the spindle in wt and mutant oocytes, which is located in the lower left corner, whereas the polar body is in the upper right corner. Scale bar: 25 μm. (F) Suf/Spastizin is required for cytokinesis. Embryos at 32-cell stage from heterozygous wt (top panel) or homozygous (bottom panel) suf/spastizin mothers with labeled nuclei (DAPI; blue) and plasma membranes (Phalloidin; green). In contrast to wt, few eggs from mutant mothers initiate cell division after fertilization, but then show cells with multiple nuclei (arrowhead). PHENOTYPE:
|

Suf/Spastizin and Rab11b colocalize on cortical granules. Optical sections of stage III oocytes showing the localization of (A, A2) Rab11b (green) or (B, B2) Suf/Spastizin (green) on cortical granules (CG) labeled with MPA-lectin (red). Scale bar: 50 μm. Stippled boxes in A, B highlight magnified area in A2, B2. (C–E) Rab11b and Suf/Spastizin colocalize in central, optical sections on cortical granules. Confocal section showing colocalization of Rab11b (green) (C) or Suf/Spastizin (green) (D) on cortical granules (red) in wild-type oocytes. (E) Upper row: Single channels of Rab11b (green; left panel) and MPA-lectin (red; center panel) showing localization of Rab11b on cortical granules (yellow; right panel). Lower row: Single channels of Suf/Spastizin (green) on cortical granules (red) forming a polarized microdomain on the granule membrane (yellow). Scale bar: 20 μm. |
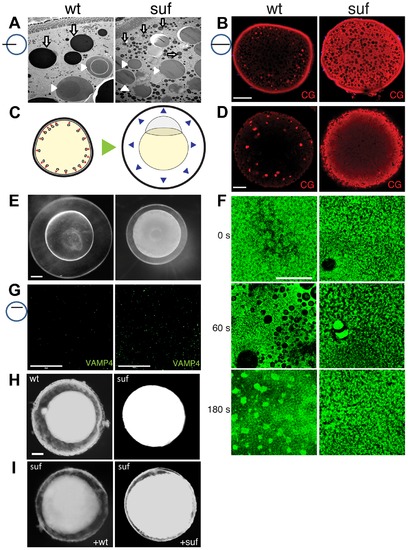
Suf/Spastizin controls cortical granule maturation. (A) Electron micrographs of high-pressure frozen stage III oocytes. Lysosomes (white arrows) are fragmented in suf/spastizin mutants. Cortical granules (white arrowheads) show a dense-core (dashed circle), which is lost in mutant oocytes. Note, that we consistently generated wrinkles visible as black lines in mutant cortical granules, which indicate sectioning artifacts, but suggest a different composition. Scale bar: 10 µm. (B) Optical section of stage III oocytes showing the accumulation of cortical granules stained with MPA-lectin (red) in suf/spastizin mutant mothers. Scale bar: 50 μm. (C) Scheme visualizing the exocytosis of cortical granules (red arrowheads, left panel) after egg activation, which leads to chorion elevation (blue arrowheads, right panel) at the beginning of embryogenesis. (D) Cortical granules labeled with MPA-lectin (red) are released after activation in wt, but not in mutants. Scale bar: 50 µm. (E) Fertilized embryos 30 mpf (min post fertilization) from +/- (left panel) and -/- suf/spastizin mutants (right panel). Note the decreased elevation of the chorion in mutants. Scale bar: 100 μm. (F) Actin cortex of stage V eggs stained with phalloidin (green) at 0, 60 and 180 s after activation. Note the fusion of vesicles in wt eggs after 60 s, visible as black holes in the actin meshwork, and the formation of actin patches at 180 s after exocytosis completion. Scale bar: 50 μm. (G) VAMP4 (green) labels immature secretory granules and accumulates in suf/spastizin mutant oocytes. Scale bar 50 µm. (H) Stage III oocytes from +/- (wt) or -/- suf/spastizin mutants (mut) after 12–16 h incubation in L-15 medium. Scale bar: 50 μm (I) Stage III oocytes from -/- suf/spastizin mutants after injection of plasmid encoding wt or mutant Suf (p96re allele). Note that the mutant Sufp96re injected oocytes also show chorion elevation similar to wt Suf injected oocytes. |

Suf/Spastizin regulates vesicle fission. (A) Electron micrographs of high-pressure frozen stage III oocytes. Cisternae with Clathrin coated buds accumulate in suf/spastizin oocytes (white arrowheads). Scale bar: 0.5 μm. (B–D) Stage III oocytes labeled with Clathrin (green; B, D) Dynamin (green; C, D) or MPA lectin (red; D). Clathrin and Dynamin localize to a subset of cortical granules. Note the accumulation of Dynamin on vesicles at the cortex in suf/spastizin oocytes (C). (E, F) Dynasore partially mimics the suf defect. Wt oocytes accumulate the cortical granule marker MPA-lectin (red) after treatment with Dynasore (E) similar to suf mutant oocytes (F). The huge compartment in the center of the Dynasore treated wt oocyte in panel E shows the germinal vesicle (oocyte nucleus). (G) Cortical granules continuously mature after ovulation. Stage V eggs were incubated with carrier (Co: upper row) or Dynasore (Dyn.; lower row) for 5, 15 or 30 min and then activated with H2O. The degree of chorion expansion correlates with Dynasore treatment duration. Note that the complete block of exocytosis also leads to opaque cytoplasm similar to suf mutants. (H) Working model for Souffle (red) function on immature secretory granules (ISG). Suf/Spastizin is necessary for the abscission of Clathrin-coated buds. Whereas the compartment matured into secretory, cortical granules (CG) with a dense-core, the Clathrin-coated vesicles enter the endolysosomal transport route probably to lysosomes. |

Phenotype of embryos after Suf/Spastizin morpholino-injection. Lateral views of embryos 48 h post fertilization (hpf), anterior to the left, after injection of control-morpholino (A) or a Suf/Spastizin specific translation block morpholino (B). The Suf-morpholino causes a twisted tail in 43% of the embryos (left panel), whereas 35% of the embryos show no morphological abnormalities. (C) Quantification of phenotypes. |
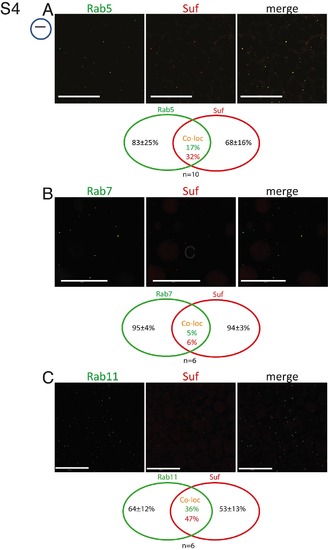
Single channels of Suf and Rab colocalization. Partial colocalization of Suf/Spastizin (red) with Rab-GTPases. (A) Rab5 (green) shows some colocalization with Suf. Venn diagram quantifying Rab5 and Suf costaining. Counting red, green and yellow foci of oocytes (n = 10) reveals that 83±25% Rab5 spots are negative for Suf and 68±16% Suf spots are negative for Rab5. Hence, 17% of the Rab5 positive vesicles contain Suf and 32% of the Suf positive vesicles Rab5. (B) Rab7 shows almost no colocalization with Suf, whereas Suf colocalizes with Rab11 vesicles more frequently (C). Scale bar: 50 µm. Small icon next to figures indicates the level of the optical section (black line) in the oocyte (blue circle). |
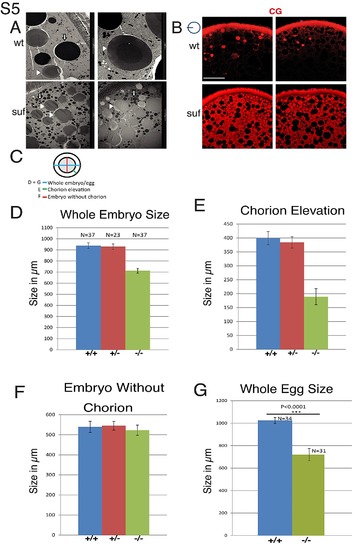
Suf/Spastizin controls cortical granule maturation. (A) Electron micrographs showing yolk globules and mature cortical granules in wt oocytes (top row). Note the darker dense core in the center of mature cortical granules. Suf/Spastizin mutant oocytes (bottom row) show immature cortical granules without dense core. Image frame: 2 μm (top, right panel) 10 μm (other panels). (B) Suf/Spastizin mutants accumulate cortical granules. Confocal sections comparing cortical granules labeled with MPA-Lectin (red) of wt (top) and suf mutants (bottom). Small icon next to figures indicates the level of the optical section (black line) in the oocyte (blue circle). Scale bar: 50 μm. (C–G) Quantification of chorion elevation defect in suf/spastizin mutant embryos and eggs. (C) Small icon indicates distances quantified in bar diagrams of panel D (blue; whole embryo diameter including chorion), E (green; distance between embryo and chorion) and F (red; embryo diameter minus chorion). (D) Quantification of whole embryo size including chorion from +/+ (blue), +/- (red) and -/- (green) mothers at 30 mpf (+/+ n = 37; +/- n = 23; -/- n = 37). (E) Chorion elevation (distance between embryo and chorion). (F) Embryo diameter minus chorion. (G) Diameter of wt (blue) and mutant eggs (red) 30 min after activation in water. Error bars represent standard deviation. Sample size (n-value) is identical for panel D, E and F. |

Rescue of chorion elevation defect. (A) Quantification of plasmid injection experiments in Figure 6 H and I showing the number of oocytes with elevated chorions. Error bars represent standard deviation. (B) Morphological phenotype (upper row) of chorion elevation in activated wt (wt + co plasmid) (100%; n = 55), but not in mut oocytes after injection with control DNA (suf + Co plasmid) (0%; n = 56). Mutant oocytes injected with plasmid encoding wt Suf (mut + wt Suf) (87.5%; n = 56) or mut Sufp96re (mut + mut Sufp96re) (67.9%; n = 53) show chorion elevation. Rescue of MPA-lectin (middle row) and VAMP4 (lower row) accumulation on immature secretory granules after injection of plasmid encoding wt Suf (mut + wt Suf) or mut Sufp96re (mut + mut Sufp96re) into mutant oocytes. Scale bars: 50 μm. |
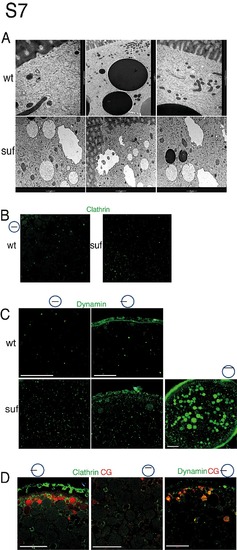
Suf/Spastizin is essential for vesicle fission. (A) Accumulation of Clathrin-coated cisternae in suf/spastizin mutants. Electron micrographs showing cellular compartments from wt (top row) and suf/spastizin mutants (lower row). The cortex region is marked by the fenestrated area in some panels, which represents the zona radiata forming the chorion membrane after fertilization. Bottom panels show vesicular compartments accumulating Clathrin buds on their membrane in suf/spastizin mutants. Picture frame: 1 μm (left column) 2 μm (middle and right column). (B–D) Dynamin and Clathrin accumulation on cortical granules of suf/spastizin mutants. (B) Confocal sections comparing Clathrin localization (green) in wt and suf/spastizin mutants. (C) Confocal sections comparing Dynamin localization (green) in wt and suf/spastizin mutant oocytes. Left column shows optical section in the oocyte center. Middle column: optical section of cortex region. Right panel: Cortical section showing the accumulation of Dynamin (green) in mutants. (D) Colocalization of Clathrin (green) or Dynamin (green) on cortical granules (red). Left panel of Clathrin staining shows the cortex region and right panel shows the center of the oocyte. Dynamin panel shows cortex region. Scale bar: 50 μm. Small icon next to figures indicates the level of the optical section (black line) in the oocyte (blue circle). |

The Dynamin inhibitor Dynasore mimics the suf/spastizin phenotype. Cortical granules stained with MPA-Lectin (red) in wild type (A, B) or suf/spastizin mutants (C, D) after treatment with the carrier DMSO (A, C) or with Dynasore (B, D). The dashed square in panel C indicates the magnification in panel E. (E) In untreated, suf/spastizin mutants MPA-Lectin (red) foci accumulated on the surface of MPA-negative vesicles similar to the cisternae discovered by EM suggesting that MPA-Lectin cargo is sorted, but not pinched off the compartment. (F) Cortex region of suf/spastizin oocyte before and after Dynasore treatment. Remarkably, suf mutants treated with Dynasore showed cortical granules with weak MPA-Lectin background (white arrowheads), which suggested that Dynasore inhibited sorting and removal of the MPA-Lectin cargo into buds. Small icon next to figures indicates the level of the optical section (black line) in the oocyte (blue circle). Scale bar: 50 μm. (G) Quantification of total egg size shown in Figure 7G. Note the significant size reduction of chorion elevation after 15 min. Error bars represent standard deviation. (H) Cellular marker analysis of ovulated stage V eggs. A 30 min treatment with Dynasore of ovulated eggs leads to an accumulation of MPA-lectin (red) and VAMP4 (green) similar to suf mutants. Scale bar: 50 μm. |