
- Title
-
Distinct regulation of the anterior and posterior myeloperoxidase expression by Etv2 and Gata1 during primitive Granulopoiesis in zebrafish
- Authors
- Glenn, N.O., Schumacher, J.A., Kim, H.J., Zhao, E.J., Skerniskyte, J., Sumanas, S.
- Source
- Full text @ Dev. Biol.
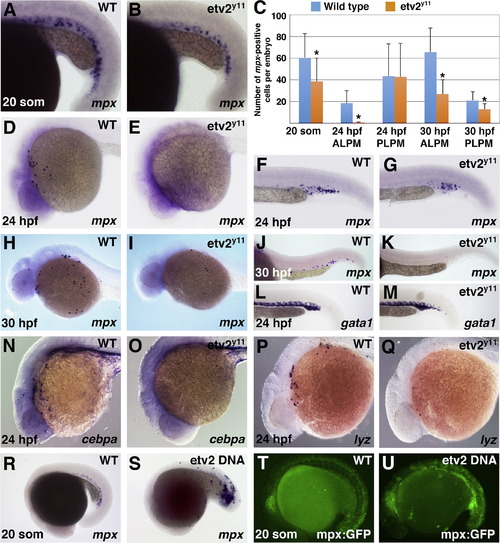
Etv2 function is necessary for neutropoiesis in the ALPM and is sufficient to initiate mpx expression. (A–K) Anterior but not posterior mpx expression is greatly reduced or absent in etv2y11mutants, as analyzed by in situ hybridization. (A and B) mpx expression is slightly reduced in the ICM region of etv2y11 mutants (B) as compared to their wild-type siblings (A) at the 20 somite stage. (C) Number of mpx-expressing cells at various stages in the anterior and posterior lateral plate mesoderm of wild type and etv2y11 mutant embryos. The cells were counted in 30 wt and 23 etv2y11 mutant embryos at the 20-somite stage, 16 wt and 16 mutant embryos at 24 hpf and 10 wt and 9 mutant embryos at 30 hpf. Error bars correspond to±standard deviation. Asterisks denote significant differences (p<0.05) calculated by Studentós T-Test. (D and E) mpx expression is strongly reduced at 24 hpf in the ALPM of etv2y11 mutants (E) compared to wild type siblings (D). (F and G) mpx expression has only a minor reduction in the ICM region of etv2y11 mutants (G) compared to their wild-type siblings (F). (H–K) mpx expression is reduced at 30 hpf in the anterior (I) and posterior (K) of etv2y11 mutants compared to wild type siblings (H and J). (L and M) gata1 expression is not significantly affected in etv2y11 mutants (M) as compared to wild-type siblings at 24 hpf (L). (N and O) cebpa expression at 24 hpf is strongly reduced in 100% of etv2y11 mutants (O, n=11) while it is strongly expressed in 100% of wild-type siblings (N, n=11). (P, Q) lyz expression is strongly reduced in 100% of etv2y11 mutants (Q, n=14) compared to 100% of wild-type siblings with normal lyz expression (P, n=15). (R–U) Etv2 DNA overexpression results in ectopic mpx expression as analyzed by in situ hybridization (R and S) and mpx:GFP live fluorescence (T and U) at the 20-somite stage (65% of etv2-injected embryos with increased or ectopic mpx:GFP, n=115 as opposed to 0% controls, n=39). Note that mpx:GFP exhibits non-specific GFP fluorescence in the neural tube. All embryos are positioned with the anterior to the left and dorsal side up. EXPRESSION / LABELING:
|
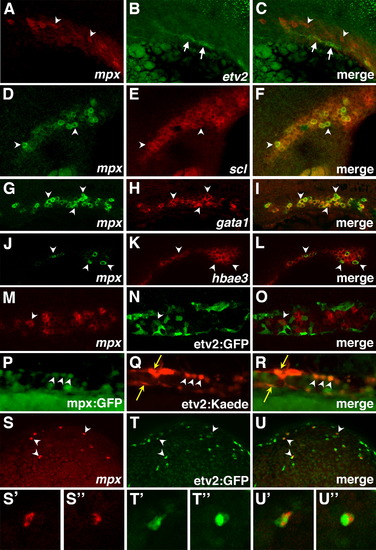
Comparison of mpx, etv2, scl, gata1, hbae3, etv2:GFP and etv2:Kaede expression. (A–L) mpx expression overlaps with scl, gata1 and hbae3, but not etv2, in the ICM of wild-type embryos at the 22-somite stage, as analyzed by two color in situ hybridization. (A–C) etv2 (arrows), and mpx (arrowheads) expression domains largely do not overlap. Maximum intensity projections of confocal images are shown. Autofluorescent yolk granules are apparent in the lower left corner in (B and C). (D–F) mpx expression partially overlaps with scl expression (selected overlapping cells, arrowheads). Single confocal slices are shown. (G–I) mpx and gata1 expression largely overlap (arrowheads, selected cells). Single confocal slices are shown. (J–L) mpx and hbae3 expression largely overlap (arrowheads, selected cells). Note that not all hbae3 cells are positive for mpx expression. Single confocal slices are shown. (M–O) Only a fraction (10.8%) of mpx-expressing cells in the ICM overlap with etv2:GFP expression at the 24 somite stage, as observed by combined ISH for mpx expression and immunohistochemistry for GFP. (P-R) etv2:Kaede and mpx:GFP expression overlaps in neutrophils (white arrowheads) in the trunk ICM region of embryos at 24 hpf. Yellow arrows denote vascular endothelial cells. (S–U) Multiple (64%) ALPM-derived mpx-expressing cells, positioned over the yolk, overlap with etv2:GFP expression at 24 hpf (white arrowheads) as observed by combined ISH for mpx expression (red) and immunohistochemistry for GFP (green). (S′–U′′) Magnified views of individual cells from S–U. Images show anterior to the left and dorsal up in all panels. EXPRESSION / LABELING:
|
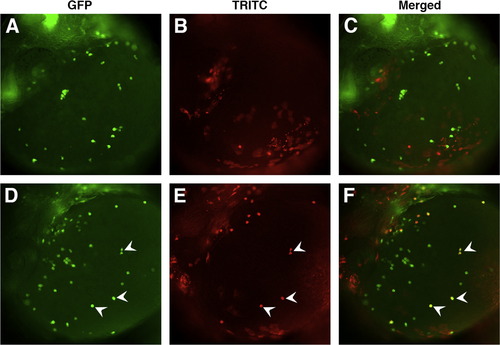
etv2 functions cell autonomously in neutropoiesis. Donor mpx:GFP embryos were injected with either TRITC-dextran tracer or TRITC-dextran and etv2 DNA, and the cells were transplanted at the sphere stage (4 hpf) into mpx:GFP recipient embryos. (A–C) Wild type cells transplanted into a wild type host do not induce mpx expression. (A) mpx:GFP, (B) TRITC and (C) merged fluorescence in the recipient embryos at 26 hpf stage. (D–F) A subset of etv2-overexpressing cells transplanted into a wild type host induce mpx expression autonomously. (D) mpx:GFP, (E) TRITC and (F) merged fluorescence in the recipient embryos at 26 hpf stage. White arrowheads point to overlapping cells, indicating that they are derived from the donor etv2-overexpressing embryos. EXPRESSION / LABELING:
|
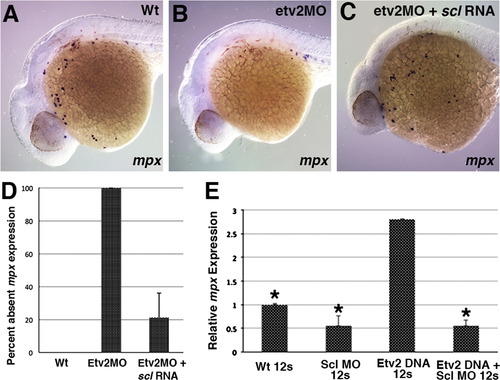
scl functions downstream of etv2 during neutropoiesis in the ALPM. (A-D) scl RNA can rescue anterior mpx expression in etv2 knockdown embryos, as analyzed at 24 hpf. mpx expression in etv2 morphants (B, n=19/19) is decreased as compared to the wild type siblings (A, n=26/26). Injection of scl RNA rescues mpx expression in etv2 morphants (C, n=23/29). All embryos are positioned with anterior to the left and dorsal side up. (E) Morpholino knockdown of scl reduces the induction of mpx by etv2 DNA, as analyzed by real-time RT-PCR at the 12-somite stage. mpx expression is increased in etv2 DNA injected embryos, relative to uninjected controls but is not changed significantly when etv2 DNA is co-injected with scl MO. Relative expression levels have been normalized to EF1α expression. Asterisk denotes statistical significance vs. etv2 DNA over-expression (p<0.01) as analyzed by one-way ANOVA test with pair-wise comparison. Error bars correspond to±standard deviation. (n=3). |

Knockdown of scl and gata1, but not pu.1, results in the loss of PLPM-specific mpx expression at the 22- and 20-somite stage. (A, B) Wild type expression of embryonic globin hbae3 (A), and mpx (B) is normal in 100% (n=23) and 61% (n=28) of control uninjected embryos, respectively, in the intermediate cell mass region at the 22-somite stage. (C and D) scl morpholino knockdown results in the loss of hbae3 (C) and mpx (D) expression in 100% (n=24) and 97% (n=32) of embryos, respectively. (E and F) Knockdown of pu.1 does not affect hbae3 expression (E, 100% of embryos, n=54), or mpx expression (F, 70% of embryos, n=37). (G and H) Wild type expression of embryonic globin hbae3 (G), and mpx (H) in the intermediate cell mass region at the 20-somite stage is normal in 100% (n=20) and 78% (n=60) of control uninjected embryos, respectively. (I and J) Knockdown of gata1 results in the loss of expression of both hbae3 (I) and mpx in 100% of embryos, n=28 and n=100, respectively (J). (K and L) mpx expression is strongly reduced or absent in the anterior of mpx morpholino knockdown embryos (L, 92% of embryos, n=25) compared to uninjected controls (K, 13% of embryos, n=8). (M and N) mpx expression is normal in the posterior of mpx morpholino knockdown embryos (N, 88% of embryos, n=25) compared to uninjected controls (M, 75% of embryos, n=8). EXPRESSION / LABELING:
|

gata1 is required to initiate mpx expression in the ICM region, but later represses it. (A–H) pu.1 expression is greatly increased (n=16/16 and 31/31) while mpx expression is greatly reduced (n=66/66 and 26/26) as analyzed by ISH in gata1 MO knockdown embryos at the 20-somite (A–D) and 24-somite (E–H) stages, respectively. (I–P) Both pu.1 and mpx expression are greatly increased in gata1 morphant embryos at 26 hpf and 32 hpf (n=35/35 and 30/33 for pu.1 expression; n=27/31 and 21/24 for mpx expression at 26 hpf and 32 hpf, respectively). Dorsal is up and anterior is to the left in all panels. EXPRESSION / LABELING:
|
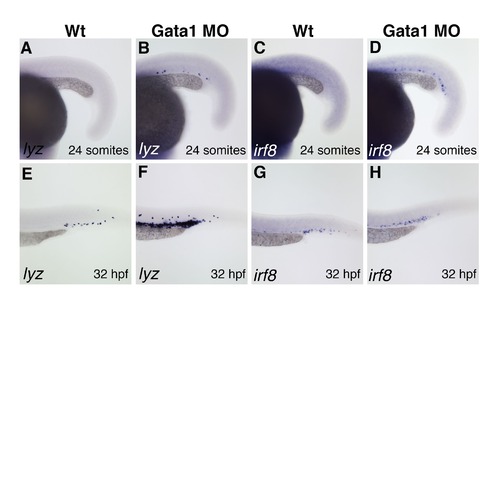
Expression of neutrophil and macrophage markers lyz and irf8 in gata1 morphant embryos. (A,B) lyz is precociously expressed in the ICM in gata1 MO knockdown embryos (B, n=11/13) compared to uninjected controls (A, n=0/14) at the 24-somite stage. (C,D) irf8 is precociously expressed in the ICM in gata1 MO knockdown embryos (D, n=8/13) compared to uninjected controls (C, n=0/14). (E,F) lyz expression is greatly increased in gata1 MO knockdown embryos at 32 hpf (F, n=17/17) compared to uninjected controls (E, n=0/14). (G,H) irf8 expression is increased in gata1 MO knockdown embryos at 32 hpf (H, n=15/17) compared to uninjected controls (G, n=0/14). Dorsal is up and anterior is to the left in all panels. EXPRESSION / LABELING:
|

Expression of mpx in gata1 and tnnt2a morphant embryos at 32hpf. (A,B) mpx expression is normal in the posterior of tnnt2a MO knockdown embryos (B, n= 15/15) compared to uninjected controls (A, n=19/19). (C,D) mpx expression is similarly increased in the posterior of gata1 MO knockdown embryos (C, n=8/8) and gata1/tnnt2a MO knockdown embryos (D, n=15/15). Dorsal is up and anterior is to the left in all panels. EXPRESSION / LABELING:
|
Reprinted from Developmental Biology, 393(1), Glenn, N.O., Schumacher, J.A., Kim, H.J., Zhao, E.J., Skerniskyte, J., Sumanas, S., Distinct regulation of the anterior and posterior myeloperoxidase expression by Etv2 and Gata1 during primitive Granulopoiesis in zebrafish, 149-59, Copyright (2014) with permission from Elsevier. Full text @ Dev. Biol.