
- Title
-
Differential reparative phenotypes between zebrafish and medaka after cardiac injury
- Authors
- Ito, K., Morioka, M., Kimura, S., Tasaki, M., Inohaya, K., Kudo, A.
- Source
- Full text @ Dev. Dyn.
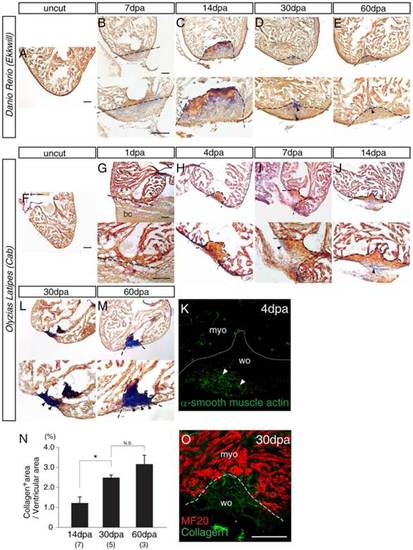
Comparative analysis of the repair process in zebrafish and medaka hearts after ventricular resection. A–L: Cryosections of fish hearts stained with acid fuchsin orange G (AFOG; fibrin, orange; collagen, blue). A–E: Uncut (A) and injured Ekkwill zebrafish hearts (B–E). Fibrin tissues were observed at both 7 (B) and 14 dpa (C), but were absorbed by 30 dpa (D). Collagen was seen from 7 dpa (B) and then was mostly absorbed by 60 dpa (E). F–M: Uncut (F) and injured (G–M) Cab medaka hearts. A blood clot was seen at 1 dpa (G) and was replaced by fibrin by 4 dpa (H). The fibrin was absorbed by 30 dpa (L). Collagen began to accumulate from 7 dpa (I), and this accumulation increased thereafter (J, L, and M). Dense collagenous tissue covered the wound area by 60 dpa (M). Black arrowheads indicate collagen tissues. K: Immunohistochemistry with anti-α-smooth muscle actin antibodies at 4 dpa. White arrowheads indicate putative myofibroblasts. N: Quantification of collagen-positive area ratio indicates scar formation at 30 and 60 dpa. Student′s t-test, *p < 0.05. N.S., not significant. Numbers in parentheses indicate the sample number. O: Immunohistochemistry of MF20 for medaka cardiomyocytes and with anti-collagen I antibodies in the injured area at 30 dpa. The dashed line indicates the approximate injury border. bc, blood clot; myo, myocardium; wo, wound area. Shown are representative images from experiments repeated > 3 times. Scale bars = 100 µm. |
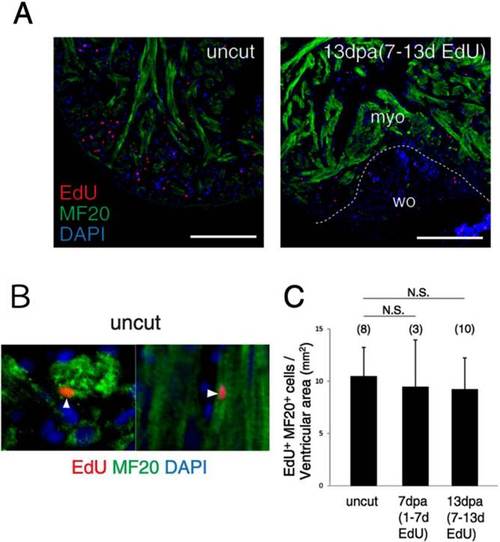
Cardiomyocyte proliferation after ventricular resection. A: Fluorescent images of EdU/ MF20 double-stained hearts. EdU-incorporating uncut and resected (13 dpa) hearts are shown (EdU incorporated from 7 to 13 dpa). B: Representative EdU/ MF20 double-positive cardiomyocyte (arrowhead) in the uncut heart. C: Quantification of EdU/MF20 double-positive cells in the ventricle. The count was normalized by the ventricular area. Numbers in parentheses indicate the sample number. Student′s t-test, N.S., not significant. The dashed line indicates the approximate injury border. myo, myocardium; wo, wound area. Scale bars = 100 µm. |

GFP expression patterns of the medaka fli1-GFP transgenic line after ventricular resection. A–D: Fluorescent images of hearts of the fli1-GFP transgenic line: uncut heart (A) and resected hearts at 4 dpa (B), 7 dpa (C), and 14 dpa (D). Infiltration of the wound site by GFP-positive cells was not observed by 14 dpa (D). For observing GFP signals, we used anti-GFP antibodies for detecting stronger signals, compared with intact signals from the transgenic line. PI signals show nuclei. PI merge panels are shown to clarify the injury area. The panel with GFP signals without PI shows all GFP signals including weak GFP signals that may be hidden by PI signals in the wound area. The dashed line indicates the approximate injury border. myo, myocardium; wo, wound area. PI, propidium iodide. Shown are representative images from experiments repeated > 3 times. |
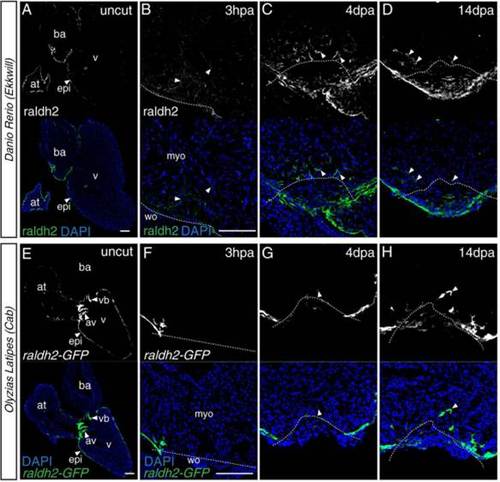
Raldh2 analysis after ventricular resection. A–D: Fluorescent images of immunostaining for raldh2 in the zebrafish heart (black-white images in the upper row). Raldh2 localization was observed in the epicardium of the uncut heart (A). At 3 hpa (hours post-amputation), endocardial localization of raldh2 was observed (B). Endocardial localization was strengthened and retained at 4 dpa (C) and 14 dpa (D). Raldh2 localization was also observed at the wound site at 4 dpa (C) and 14 dpa (D). E–H: Fluorescent images of heart of the medaka raldh2-GFP transgenic line (black-white images in the upper row). Raldh2 expression was observed in the epicardium of the uncut heart (E). At 3 hpa, only epicardial expression was observed (F). Raldh2-GFP positive fibroblast-like cells were observed in the wound and myocardial area at 4 dpa (G) and 14 dpa (H), whereas no endocardial raldh2 expression was observed. Arrowheads indicate the raldh2 expression or localization. The dashed line indicates the approximate injury border. at, atrium; av, atrio-ventricular valves; ba, bulbus arteriosus; epi, epicardium; myo, myocardium; v, ventricle; vb, ventriculo-bulbal valves; wo, wound area. Shown are representative images from experiments repeated > 3 times. Scale bars = 100 µm. |

Periostin localization patterns in zebrafish and medaka injured hearts. A–J: Zebrafish hearts immunostained with anti-zebrafish periostin antibodies. K–T: Medaka hearts immunostained with anti-medaka periostin antibodies. A–E: Zebrafish periostin-a localization patterns. Periostin-a was localized at atrio-ventricular (av) valves and ventriculo-bulbal (vb) valves in the uncut heart (A). No localization was observed in the wound after resection (B–E). F–J: Zebrafish periostin-b localization patterns. Periostin-b was localized in the epicardium and valves (data not shown) in the uncut heart (F). The localization was observed at the wound site at 7 dpa (G), 14 dpa (H), and 21 dpa (I). Endocardial localization was detected at 14 dpa (H, arrowhead) and 21 dpa (I, arrowhead). The localization was restricted to the epicardium by 30 dpa (J, arrowhead). K–O:. Medaka periostin-a localization patterns. Periostin-a localization was observed in the epicardium and valves in the uncut heart (K). The localization was observed in the epicardium during repair (L–O), and its expression seemed to cover the wound. The signal was also observed in the endocardium occasionally (N, white arrow). P–T: Medaka periostin-b localization patterns. Periostin-b was localized in the atrium (P) and valves (data not shown). The localization was observed at the wound and the injury border from 7 dpa to 30 dpa (Q–T) Z postn, zebrafish periostin; M postn, medaka periostin. Arrowheads indicate periostin localization. The dashed line indicates the approximate injury border. at, atrium; av, atrio-ventricular valves; ba, bulbus arteriosus; epi, epicardium; myo, myocardium; v, ventricle; vb, ventriculo-bulbal valves; wo, wound area. Shown are representative images from experiments repeated > 3 times. Scale bars = 100 µm. |