
- Title
-
Dhrs3a regulates retinoic acid biosynthesis through a feedback inhibition mechanism
- Authors
- Feng, L., Hernandez, R.E., Waxman, J.S., Yelon, D., and Moens, C.B.
- Source
- Full text @ Dev. Biol.
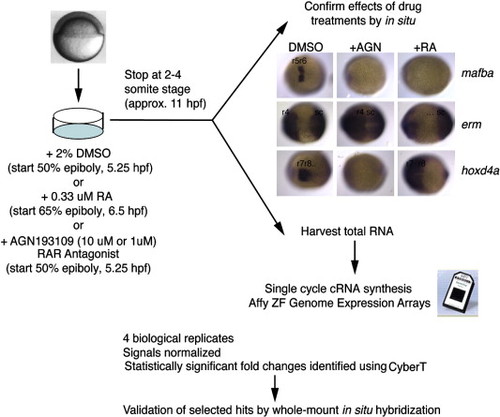
Strategy for microarray identification of RA-regulated genes. Wild-type embryos were treated with RA, RA signaling antagonist (AGN193109) or DMSO (control) as shown. Treated embryos were collected at the 2–4 somite stage (about 11 hpf). A subset of treated embryos were fixed for in situ hybridization with mafBa, erm, or hoxd4, to confirm the drug treatment effect, and the remainder was used for RNA harvest. Four separate treatments were performed. After a single cycle of cRNA synthesis, the hybridization was carried out on Affymetrix Zebrafish Genome Expression chips. Selected hits were validated by in situ hybridization. EXPRESSION / LABELING:
|
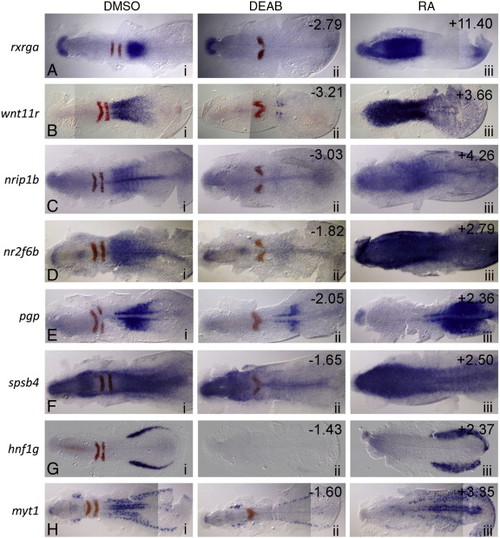
In situ validation of microarray hits whose expression is increased in RA-treated embryos and reduced in antagonist-treated embryos. Dorsal views of eight selected microarray hits (blue) and egr2b (red) in situ at 11 hpf. Anterior is to the left in all panels. Column i: control (DMSO) treated; ii: 10 µM DEAB (RA synthesis antagonist) treated; iii: 0.33 µM RA-treated. The numbers in the upper right corners refer to the fold-change in expression level identified on the microarray under the corresponding conditions. EXPRESSION / LABELING:
|
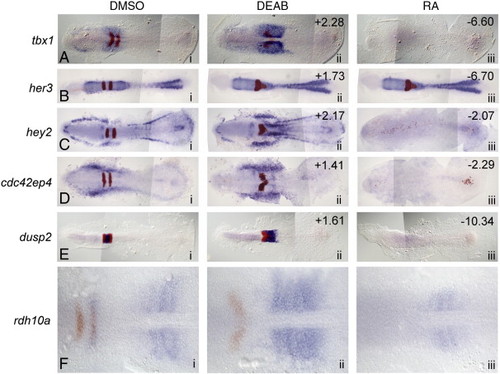
In situ validation of microarray hits whose expression is decreased in RA-treated embryos and increased in antagonist-treated embryos. (A–E) Dorsal views of five selected microarray hits (blue) and egr2b (red) at 11 hpf. Anterior is to the left in all panels. Column i: control (DMSO) treated; ii: 10 µM DEAB (RA synthesis antagonist) treated; iii: 0.33 µm RA-treated. The numbers in the upper right corners refer to the fold-change in expression level identified on the microarray. (F) Although not represented on the microarray, zebrafish rdh10a is increased in RA-depleted embryos and suppressed in RA-treated embryos. EXPRESSION / LABELING:
|
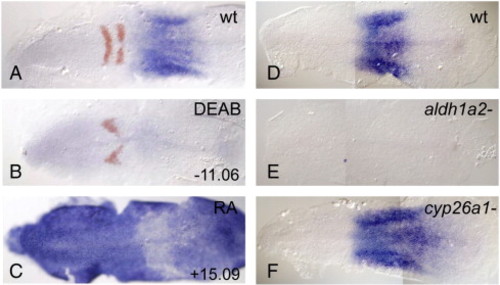
dhrs3a is expressed in an RA-dependent manner. RNA in situ hybridization of dhrs3a (blue) and egr2b (red in A–C). (A) DMSO-treated; (B) 10 µM DEAB-treated, (C) 0.33 µm RA-treated. (D) wild-type untreated, (E) aldh1a2i26/i26/neckless mutant, (F) cyp26a1rw716/rw716/giraffe mutant. Anterior is to the left in all panels. EXPRESSION / LABELING:
|
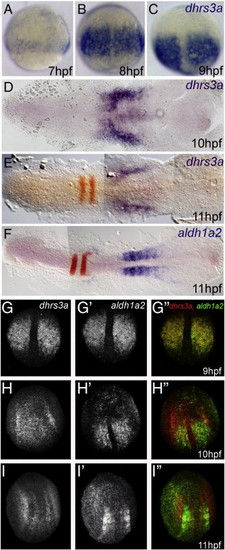
dhrs3a expression is dynamic and correlated with aldh1a2 expression. Chromogenic (A–F) and fluorescent (G–I) in situ hybridization of dhrs3a (A–E, G–I), aldh1a2 (F, G2–I2) and both (G3, H3 and I3). The red color in E–F shows the expression of egr2b. EXPRESSION / LABELING:
|
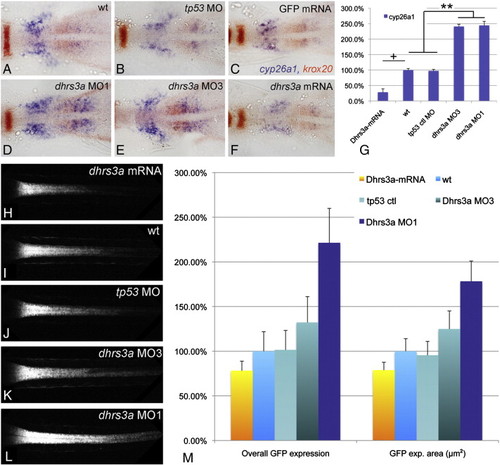
Dhrs3a functions as a regulator of RA signaling. (A–F) RNA in situ hybridizations on 5 somite stage embryos in dorsal view with anterior to the left, showing cyp26a1 expression (blue) in the anterior trunk. Red staining is erg2b in rhombomere 5 and aldh1a2 in the anterior paraxial mesoderm: (A) Uninjected control embryo; (B) control embryo injected with 5 ng tp53MO; (C) control embryo injected with 300 pg GFP mRNA; (D) embryo injected with 5 ng dhrs3a MO1 and 5 ng tp53 MO; (E) embryo injected with 5 ng dhrs3a MO3 and 5 ng tp53 MO; (F) embryo injected with 300 pg dhrs3a mRNA; (G) quantification of cyp26a1 expression by qPCR. (H–L) projections of confocal images through the spinal cord of live Tg(12XRARE-ef1a:gfp)sk71 transgenic embryos at 48 hpf. The anterior limit of GFP expression corresponds to the rhombomere 6/7 boundary: (H) dhrs3a mRNA-injected embryo; (I) uninjected control; (J) control tp53 MO-injected embryo; (K) dhrs3a MO3 plus tp53 MO-injected embryo; (L) dhrs3a MO1 plus tp53 MO-injected embryo. (M) quantification of live Tg(12XRARE-ef1a:gfp)sk71 signal in n = 6 injected with 300 pg dhrs3a mRNA, n = 6 uninjected, n = 6 tp53MO (5 ng/emb) injected, n = 6 tp53 + dhrs3a MO3 (5 ng/emb each) injected and n = 6 tp53 + dhrs3a MO1 (5 ng/emb each) injected embryos. “Overall GFP expression” is the sum of pixel intensities above background threshold; “GFP expression volume” is the total number of pixels in the confocal stack above background threshold. Values are normalized to the uninjected control. NN (ANOVA; the Newman–Kuels test) p < 0.005. N (ANOVA; the Newman–Kuels test) p < 0.05. There is no significant difference on the GFP expression volume or overall signal between wt and tp53. + (Student′s t-test) p < 0.05. dhrs3a mRNA injected embryos were normalized to control mRNA injected embryos. EXPRESSION / LABELING:
|
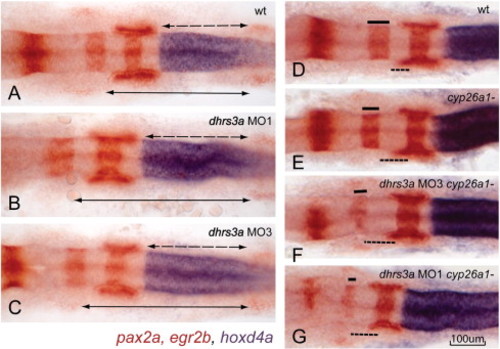
Dhrs3a knockdown effects nervous system patterning. (A–C) in situ hybridization of hoxd4a (blue), pax2a (red in mid-hindbrain boundary, otic vesicles and somites) and egr2b (red in rhombomere 3 and 5) in wt (A), dhrs3a MO1 (B) and MO3 (C)-injected embryos. Dotted arrows indicate the distance from the r6/7 boundary, marked by the anterior limit of hoxd4a expression, to the second somite (indicated by the anterior limit of pax2a expression). Solid arrows indicate the distance from the r3/4 boundary to the second somite. Both distances are longer in dhrs3a knockdown embryos. (D–G) Knockdown of Dhrs3 enhances the posteriorized hindbrain phenotype of cyp26a1 mutant embryos: (D) wt; (E) cyp26a1-/gir mutant; (F, G) cyp26a1-/gir mutant injected with dhrs3a MO3 (F) or MO1 (G). EXPRESSION / LABELING:
|
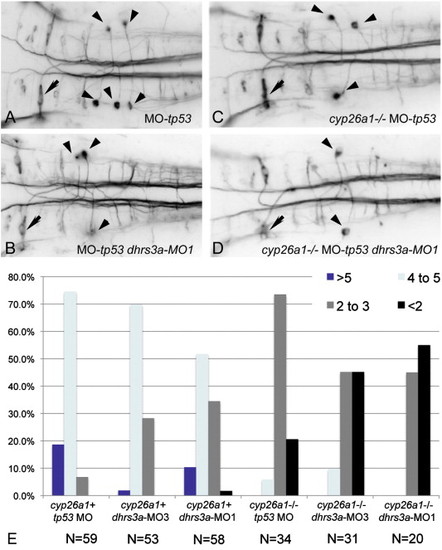
Dhrs3 knockdown effects hindbrain neuronal organization. (A–D) RMO44 immunostaining of hindbrain reticulospinal neurons: (A) control wt embryo with 5 ng tp53 MO; (B) dhrs3a MO1+tp53 MO-injected embryo; (C) cyp26a1 mutant embryo injected with 5 ng control tp53 MO; (D) cyp26a1 mutant embryo injected with dhrs3a MO1+tp53 MO. Arrows indicate the Mauthner neuron in r4, which is unaffected under all conditions; arrowheads indicate the distinctive T-interneurons which lie in r7 and anterior r8. (E) Quantification of the number of T-interneurons in each condition. N refers to the number of embryos counted. EXPRESSION / LABELING:
PHENOTYPE:
|
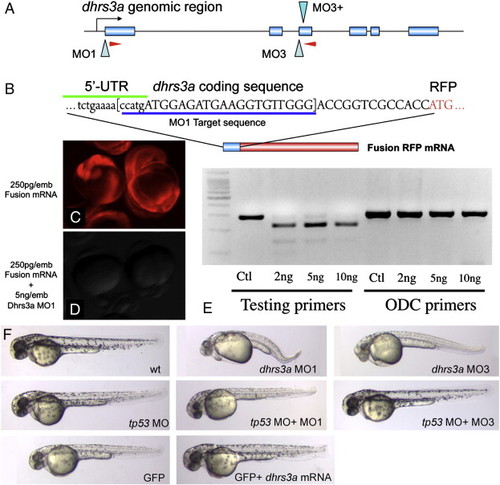
Dhrs3a morpholinos effectively knock down gene function. (A) genomic structure of the zebrafish dhrs3a locus. Two sets of morpholinos were designed. MO1 blocks translation, while MO3 and MO3+ together block splicing of exon 2 by blocking the canonical splice site and an internal, cryptic splice site within intron 3. Red arrowheads indicate primer positions for RT-PCR in (E). (B) The dhrs3a-RFP fusion mRNA used to test the efficacy of MO1. (C, D) Translation of 250 pg of this fusion mRNA can be blocked by MO1 when injected at 5 ng/embryo. (E) RT-PCR of mRNA isolated from 12 hpf embryos injected with increasing amounts of MO3 and MO3+. Lanes 1-4: amplification with dhrs3a primers shown in A; lanes 5-8: amplification with control primers for the ornithine decarboxylase locus. (F) shows 48-h MO or mRNA-injected embryos. Toxicity of dhrs3a MO1 and MO3 can be rescued by co-injection of tp53MO. |
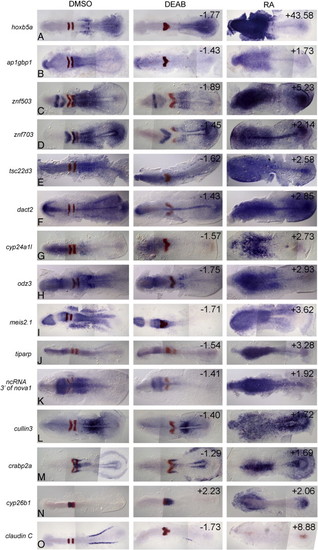
In situ validation of additional microarray hits, continued. In each example, the gene being validated is in blue and egr2b is in red in r3 and r5 as an internal control for the treatments (egr2b expression is eliminated in embryos posteriorized with 0.33 µM RA and r5 is specifically eliminated in embryos anteriorized with 10 µM DEAB). Left column: control embryos treated with 2% DMSO; center column: embryos treated with 10 µM DEAB; right column: embryos treated with 0.33 µM RA. All embryos are shown at approximately 11 hpf with anterior to the left. The numbers in the upper right corners refer to the fold-change in expression level identified on the microarray. |
Reprinted from Developmental Biology, 338(1), Feng, L., Hernandez, R.E., Waxman, J.S., Yelon, D., and Moens, C.B., Dhrs3a regulates retinoic acid biosynthesis through a feedback inhibition mechanism, 1-14, Copyright (2010) with permission from Elsevier. Full text @ Dev. Biol.