
- Title
-
Multiple modes of proepicardial cell migration require heartbeat
- Authors
- Plavicki, J.S., Hofsteen, P., Yue, M.S., Lanham, K.A., Peterson, R.E., Heideman, W.
- Source
- Full text @ BMC Dev. Biol.

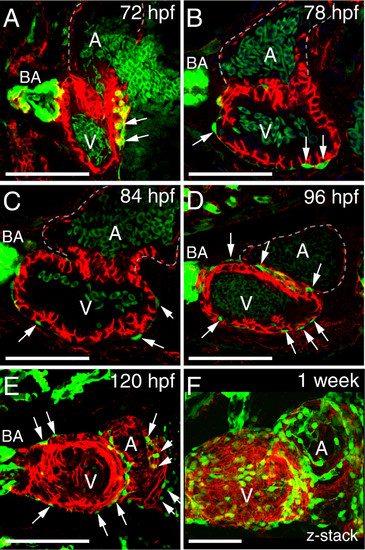
PE migration occurs through a cellular bridge to the heart. Lateral views of zebrafish hearts at 72 hpf. (A) Brightfield image of a live heart (n = 10). Arrow indicates the PE. (B) H&E stained section through heart and pericardium (n = 5). Arrow indicates the PE. (C-D) Confocal images of whole-mount fixed zebrafish. Epicardial cells marked with immunostaining for DsRed2 (red), which is driven by the tcf21 promoter. Nuclei are stained with DAPI (blue) and cardiomyocytes are marked with activated cell adhesion molecule (ALCAM; green). (C) The PE, which is outlined, forms a bridge between the ventricle and the pericardial wall (n = 10). (D) Magnified Z-stack projection and orthogonal slice of area boxed in C. Orthogonal slice at line indicated by “x” shows cross-section of cells below the line. White arrows indicate cells within the PE cluster that are not expressing tcf21. For all panels, anterior is to the left and V is ventricle. Scale bars = 50 microns. |

Ongoing PE cluster formation. Ventral (A) and lateral (B-D) views of hearts from tcf21:DsRed2 larvae. PE and epicardial cells are marked with immunostaining for DsRed2 (red) and cardiomyocytes are marked with ALCAM (green). Nuclei are stained with DAPI (blue) in panel D. (A) Confocal z-stack of heart at 74 hpf. Epicardial cells have attached to the ventricle and additional PE clusters (arrows) are forming. A PE aggregate (arrowhead) that has been released into the pericardial cavity is located near the atrioventricular (AV) junction (n = 10). (B) Confocal z-stack of a ventricle at 84 hpf. Epicardial cells are established on the ventricle. PE cells clustered on the pericardial wall projecting towards the heart (n = 10). (C) A single optical slice taken from the z-stack, showing the persisting PE cluster (arrow). (C) PE cell aggregates (white arrows) in the pericardial cavity at 120 hpf (n = 7). For all panels, anterior is to the left and V is ventricle. Scale bars = 50 microns. |
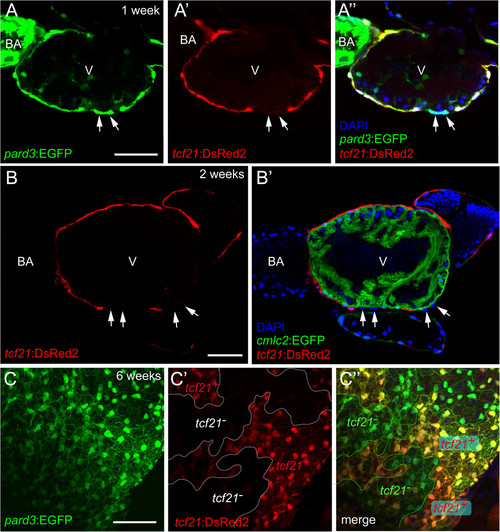
Heterogeneous tcf21 expression within the developing epicardium. Confocal images of the developing zebrafish epicardium. (A-A”) Lateral view of a 1-week pard3:EGFP; tcf21:DsRed2 heart (n = 10). (A) Epicardial cells are marked with pard3:EGFP (green). (A′) Immunostaining for DsRed2 (red). (A”) Merge of A and A′ with DAPI staining (nuclei; blue). Arrows indicate pard3+/tcf21- epicardial cells. (B-B′) Ventral view of a 2-week cmlc2:EGFP; tcf21:DsRed2 heart (n = 5). (B) Epicardial cells are marked with immunostaining for DsRed2 (red). (B′) cmlc2:EGFP; tcf21:DsRed2 heart with DAPI staining (nuclei; blue). tcf21-/DAPI + epicardial cells (arrows) are seen overlying the myocardium. (C-C”) Ventricular epicardium from a 6-week old zebrafish heart (n = 5). (C) Epicardial cells are marked with pard3:EGFP (green). (C′) Immunostaining for DsRed2 (red). (C”) Merge of C and C′. For all panels: V is ventricle, BA is bulbus arteriosus. Scale bars = 50 microns. |
Normal progression of epicardium formation. Ventral views of zebrafish hearts. (A-F) Epicardial cells are marked with pard3 (EGFP; green) and cardiomyocytes are marked with ALCAM (red). Confocal images from 72-120 hpf are optical slices showing progressive epicardium coverage (white arrows) proceeding across the ventricle (V) and then onto the atrium (A) at 120 hpf. The z-series at one-week shows epicardial cells on the ventricle and atrium, however epicardium coverage is not complete. For all panels, with anterior to the left and BA is bulbus arteriosus. Scale bars = 50 microns. For each time point n = 5. |
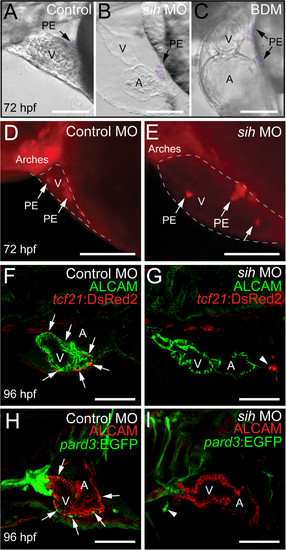
Heartbeat is not required for PE cluster formation, but is necessary for epicardium development. Lateral views of zebrafish hearts with anterior to the left. (A-C) Brightfield micrographs showing hearts from control (A), sih MO (B), and BDM-treated (C) fish at 72 hpf. The PE clusters are pseudo colored purple and indicated by arrows (n = 10 per group). (D and E) Epifluorescence images showing hearts from control (D) and sih MO-treated (E) fish at 72 hpf, using the tcf21:DsRed2 reporter to reveal PE clusters (arrows) (n = 15 per group). The pericardial space is outlined with a dashed line. (F-I) Confocal images of embryos treated with control and sih-MO collected at 96 hpf (n = 12 per group). (F and G)tcf21:DsRed2 is red and ALCAM is green. (H and I)pard3:EGFP is green and ALCAM is red. Arrows indicate epicardial cells developing across the ventricle. Arrows indicate small PE clusters expressing tcf21 or pard3. For all panels, V is ventricle; A, Atrium; BA, bulbus arteriosus. Scale bars = 50 microns. |

Inhibiting heartbeat impairs expansion of the epicardium. Lateral confocal images of zebrafish hearts at 120 hpf with anterior to the left. The epicardial marker, pard3, is green and ALCAM (cardiomyocytes) is red. Arrows in panels A and C indicate epicardial cells on the ventricle (n = 7 per group). (A) Control. (B) BDM added at 48 hpf and maintained to the end of the experiments. (C) BDM added at 72hpf and maintained to the end of the experiments. For all panels, V is ventricle; A, Atrium. Scale bars = 50 microns. |

Epicardium formation on isolated hearts in vitro. Hearts from cmlc2:EGFP; tcf21:DsRed2 larvae were extracted and placed in culture for 7 days. (A) Representative confocal image of a single ventricle prior at the time of isolation (Day 0; n = 10). (B) Confocal image of a fixed ventricle after 7 days in culture (n = 10). (C) Epifluorescent images tracking epicardium formation in culture. Images shown are from days 1, 3, 5 and 7 (n = 10). tcf21:DsRed2 marks epicardial cells (red) and cmlc2:EGFP marks cardiomyocytes (green). DAPI (DNA) is in blue in A and B. Scale bars = 50 microns. |

Inhibiting contraction prevents epicardial development in vitro. Hearts from cmlc2:EGFP; tcf21:DsRed2 larvae were extracted and placed in culture with or without BDM. (A, B, and C) Confocal images of fixed hearts were collected at the time of isolation (A) and after 7 days (B and C) in culture. (B and D) Control hearts (n = 14). (C and E) BDM treated hearts (n = 14). tcf21:DsRed2 marks epicardial cells (red) and cmlc2:EGFP marks cardiomyocytes (green). DAPI (DNA) is in blue in A-C. Scale bars in A-C = 25 microns. Scale bars in D and E = 50 microns. |

Epicardial cells from donor hearts do not migrate onto sih recipient hearts. (A) Schematic of our epicardial cell migration assay. Control tcf21:DsRed2 donor hearts (108 hpf) were co-cultured with either control or sih injected cmlc2:GFP recipient hearts (60 hpf). (B, C, D) Epicardial cells from control donors migrate onto control recipient hearts (n = 7). (E, F, G) Epicardial cells from control donors do not migrate onto sih recipient hearts (n = 7). |