
- Title
-
Activating transcription factor 6 is necessary and sufficient for alcoholic Fatty liver disease in zebrafish
- Authors
- Howarth, D.L., Lindtner, C., Vacaru, A.M., Sachidanandam, R., Tsedensodnom, O., Vasilkova, T., Buettner, C., Sadler, K.C.
- Source
- Full text @ PLoS Genet.
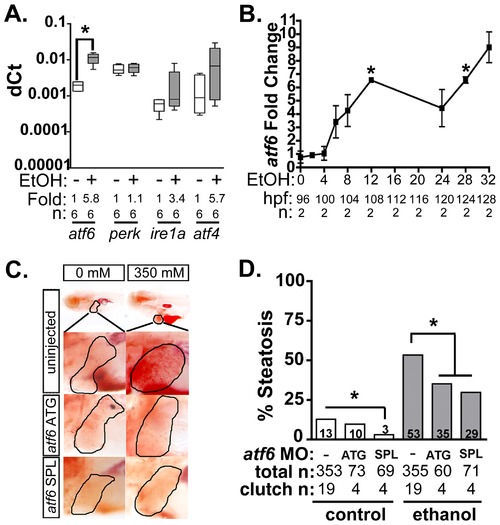
Atf6 is required for alcoholic steatosis. A: qPCR analysis of UPR sensors atf6, perk, ire1a, and atf4 in the livers of control (EtOH-) and 350 mM ethanol-treated (EtOH+) larvae. dCt values were calculated by normalization to rpp0. Fold changes were calculated based on median dCt values. Statistics: paired t-test. *, p<0.05. B: Expression of atf6 in the livers of 350 mM ethanol treated larvae from 0–32 hours. Fold changes were determined by normalizing to control (0 mM EtOH) dCt values. Statistics: one-sample t-test. *, p<0.05. C: Images of oil red O stained whole larvae injected with two different morpholinos targeting atf6 (ATG-targeting, atf6 ATG, and splice-blocking, atf6 SPL) and exposed to either 0 or 350 mM ethanol. Livers are circled in the enlarged boxes. D: Steatosis incidence based on scoring oil red O stained larvae at 5.5 dpf. Statistics: chi-square with Fisher′s Exact Test. *, p<0.05. “Total n” and “clutch n” corresponds to the number of larvae and number of clutches scored. |

nAtf6 overexpression is sufficient to drive steatosis. A: Heatmap of upregulated UPR effector genes in nAtf6 transgenic larvae. The log values based on mRNA-Seq analysis and the median fold change in 3–6 liver samples assessed by qPCR at 5 dpf and 14 dpf. B: Most Atf6 targets are upregulated in the liver in response to ethanol. Genes identified as part of the UPR are significantly induced in the liver of nAtf6 TG and ethanol treated larvae (log value e 0.2; see Table S2). C: Oil red O stained WT and nAtf6 transgenic larvae. Livers are circled in the enlarged boxes. D: Steatosis incidence based on scoring of whole mount oil red O stained larvae at 4, 5, and 5.5 dpf. Statistics: chi-square with Fisher′s Exact Test. *, p<0.05. “Total n” and “clutch n” corresponds to the number of larvae and number of clutches scored. E: Hepatic triglyceride levels in extracts from pooled livers from WT and nAtf6 transgenic larvae at 5 dpf and 14 dpf, and from single adult livers (~9 months). Statistics: unpaired t-test. *, p<0.05. Median fold changes are noted. |
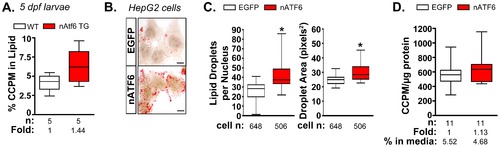
De novo lipogenesis is enhanced in vitro and in vivo by nAtf6 overexpression. A: 14C-acetate is preferentially incorporated into lipids in 5 dpf nAtf6 TG larvae compared to WT. The percent of 14C in lipid fraction was divided by 14C measured in the unextracted lysate from whole fish. The median fold change is noted; n = number of samples of pooled larvae. B: Oil red O staining of HepG2 cells transfected with GFP or nATF6. Bar = 10 μm. C: Quantification of lipid droplet number and area (square pixels). Statistics: unpaired t-test. *, p<0.05; n indicates the number of cells quantified over 20 fields from 2 independent experiments. D: Incorporation of 14C-acetate into lipids by HepG2 cells transfected with GFP or nATF6 normalized to protein. The median fold change is noted; n = number of separate batches of cells analyzed in 2 independent experiments. |
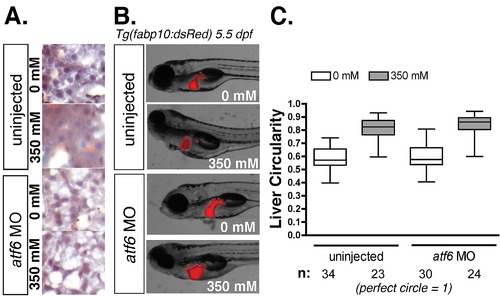
Knockdown of atf6 does not confer resistance to morphological defects from alcohol exposure. A: Oil red O staining of cryosections from uninjected and atf6 morphant larvae treated with 0 or 350 mM ethanol for 32 hours. B: Live images of uninjected and atf6 morphant Tg(fabp10:dsRed) larvae treated with 0 or 350 mM ethanol for 32 hours. C: Quantification of liver circularity, a measure of hepatomegaly, following ethanol treatment in uninjected and atf6 morphant larvae. Livers were traced and circularity quantified in ImageJ. |

Tg(fabp10:nAtf6-cherry; cmlc2:GFP) larvae express the nAtf6-cherry transgene despite a lack of visual fluorescence. A: Schematic of human ATF6 transactivation (TAD), DNA-binding (bZIP) and transmembrane (TM) domains, cleavage sites for S1P (MBTPS1) and S2P (MBTPS2), and protein alignment with zebrafish Atf6. Numbers in the diagram correspond to amino acid positions in human ATF6. Numbers at the cleavage sites in the protein alignment correspond to amino acid positions in zebrafish Atf6. B: Confirmation of nuclear localization of zebrafish nAtf6 by transfection of nAtf6-GFP/pCI-Neo into HepG2 cells. C: Live image of Tg(fabp10:nAtf6-cherry; cmlc2:GFP) larva at 5 dpf. D: Agarose gel electrophoresis showing expression of Cherry mRNA in nAtf6 TG but not WT larvae. rpp0 was used to ensure PCR efficacy. E: Western blot visualization of Cherry protein in adult nAtf6 transgenic zebrafish liver tissue. Tg(fabp10:nls-cherry) adult liver protein was used as a positive control. Actin was used as a loading control. |
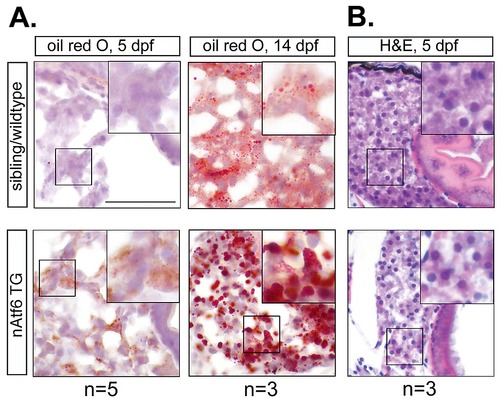
Lipid accumulation is evident in nAtf6 TG larvae in the absence of other hepatic injury. A: Staining of cryosections with oil red O showing significant steatosis in nAtf6 TG larvae at 5 and 14 dpf. B: Hematoxylin and eosin staining of nAtf6 TG and control larvae at 5 dpf. No other alterations in hepatic pathology were observed. The number of larvae used is indicated. |

Overexpression of nATF6 in 293T cells drives lipid accumulation. A: Staining of GFP and nATF6 transfected cells with oil red O. B: Quantification of lipid droplet number and area (square pixels). Droplet number and area were calculated using ImageJ. Statistics: unpaired t-test. *, p<0.05. The number of cells used for quantification is noted. |