
- Title
-
Endothelial cilia mediate low flow sensing during zebrafish vascular development
- Authors
- Goetz, J.G., Steed, E., Ferreira, R.R., Roth, S., Ramspacher, C., Boselli, F., Charvin, G., Liebling, M., Wyart, C., Schwab, Y., Vermot, J.
- Source
- Full text @ Cell Rep.

Early Cardiac Morphometrics and Subsequent Hemodynamics at Blood Flow Onset (A) 3D imaging of the heartbeat in Tg(fli:gal4FF; UAS:kaede; cmlc2:egfp) embryos. Heart myocardium is labeled in green (GFP), and endocardium and blood cells are in red (photoconverted Kaede). (B) Kymographs of a section (boxed region) of the heart tube. The asterisk indicates the absence of a visible endocardial lumen at 24 hpf. The arrows indicate the progressive opening of the lumen at 26 and 30 hpf. (C) 3D sections of the boxed regions in (A). The dashed lines underline the endocardium opening and the arrows show the flow direction. (D) Simplified view of the cardiovascular system of 24–28 hpf embryos. CA, caudal artery; CV, caudal vein; ISV, intersomitic vessels. (E) Blood cell tracking in the developing DA (see box in D). Graphs show the mean and maximum flow velocity in the DA (see box in D) and the pulsatility index (PI) at 24, 26, and 28 hpf. (F) Tracks in the DA are color-coded for their instantaneous velocity over time. (G) 3D anatomy of a 26 hpf heart and its neighboring vasculature and flow direction. See also Movies S5 and S7. (H) Vascular hemodynamics in a single embryo. Three sections of the same heart are displayed (see corresponding regions in D). Tracks are color-coded for their instantaneous velocity over time. (I) Plots of the velocity and PI observed in a single embryo. Error bars depict SEM. Statistical significance was determined by unpaired Student’s t test; p < 0.05, p < 0.01, p < 0.001. |

Early Embryonic Vessels Are Ciliated (A) Global view of a 28 hpf embryo. (B) Single confocal section of the region of interest in the CA; endothelium is in red, primary cilia are in green. Boxes define two cilia of interest located in the CA (arterial) and CV (venous). Flow direction is indicated. See also Movie S8. (C) Transmission electron microscopy (TEM) image of the region shown in (B). (D) 3D reconstruction of the region of interest (arrow points to cilium of interest). (E) TEM image of the venous cilia highlighted in (B) and (C). (F–M) Electron tomography of the arterial cilia outlined in (B)–(D). (F) Reconstruction of the portion of the protruding cilia near the cell surface. (G–L) Single tomograms and modeling of regions located in the axoneme (G and H) and the basal body (I–L) are presented. Microtubules were color-labeled along the whole cilia. Note that the light blue microtubule is incomplete over the tomogram presented in (G) and (H). See also Movies S8, S9, and S10. (M) A portion of the cilia proximal to the plasma membrane. Microtubules that disappear along the cilia axis are labeled in red. See also Movie S11. (N and O) Single tomogram and modeling of a motile cilia located in the pronephros. Note the characteristic 9+2 microtubule doublet architecture. See also Figure S2 and Movie S12. |

Blood Flow Onset Is Mechanically Detected by Primary Cilia and Transduced via a pkd2-Dependent Calcium Increase (A) High-speed confocal imaging at 29 fps and digital tracking in a Tg (flk1:mCherry; β-actin:Arl13b-egfp) embryo at 28 hpf. Note the cilium deflection and flow direction (white arrow). See also Movies S13 and S14. (B) Digital tracking permits the segmentation of cilium outlines. Consecutive outlines were color-coded over time during one deflection phase (210 ms). (C) Cilia deflection angle and flow velocity (see scheme) were quantified overtime and plotted. Note the correlation between maximum and minimum flow velocity and maximum and minimum flow deflection, respectively (red and green arrows). (D) Cilia deflection in the DA of 24, 26, and 28 hpf embryos. (F) Quantification of (D). (E and G) Calcium content in the developing DA was evaluated and quantified using the endothelial-specific expression of GCAMP3.0 in Tg(fli:gal4FF; UAS:gcamp3.0) embryos. GCAMP3.0 intensity was normalized to the average KAEDE intensity observed in distinct embryos. (H and I) Table and graphical display showing the average cilia deflection observed in 28 hpf control and indicated morphant embryos. See also Movie S15, which presents high-speed confocal imaging at 29 fps and digital tracking in a Tg(β-actin:Arl13b-egfp) embryo at 28 hpf injected with the tnnt2a MO. Note the absence of cilium deflection over a 210 ms period and random particle movement (blue track). The cilium is not deflected and remains perpendicular to the vessel wall. (J) Blood flow velocity was quantified using transmission of light in embryos carrying the Tg(fli:gal4FF; UAS:gcamp3.0) transgene quantified in (K). Note the absence of flow in tnnt2a morphants. See an example in Movie S16. (K) Calcium content in the developing DA was evaluated in different conditions and quantified using the endothelial-specific expression of GCAMP3.0 in Tg(fli:gal4FF; UAS:gcamp3.0) embryos. (L) Summary graphical representation. The diagram shows that the early developing ECs are sensitive to low flow forces. Protruding and highly sensitive primary cilia behave as flow sensors and allow a fine detection of low but increasing flow forces during blood flow onset. Flow-mediated cilia deflection allows a PKD2-dependent calcium influx in the endothelium. Error bars depict SEM. Statistical significance was determined by unpaired Student’s t test; p < 0.05, p < 0.01, p < 0.001. See also Figures S3 and S4. |

Early Hemodynamics Control Embryonic Angiogenesis (A) The protrusive activity of the CV was assessed in controls, sih mutants, and pkd2 morphants at 26 hpf. Yellow arrowheads point to vascular sprouts of the CV. Note the absence of such sprouts in both the sih mutants and pkd2 morphants. Using the Tg(fli1a:neGFP)y7 transgenic line, we tracked the nuclei of ECs at the migration front of the CV (scheme) and followed their movement over a 1 hr period. See also Movie S18. The graph shows the average net distance covered by the tracked cells in control, mutant (sih), and morphant (pkd2 and gata1) embryos (between three and four embryos were imaged per condition). (B) Vascular morphogenesis of the CV was assessed in controls, sih mutants, and pkd2 morphants at 28 hpf. Asterisks point to vascular loops, which are mostly absent in sih mutants and pkd2 morphants (see scheme). 3D models of the vascular lumens of a delimited region (two somites) of the caudal plexus were created and are displayed as orthogonal and side views. The CA is colored in red and the CV is in blue. Images are representative of three to eight embryos imaged per condition. See also Movie S19. Arrowheads point to distinct vessels of the CV. Note that a single vessel is observed in both sih mutants and pkd2 morphants. The graph shows the number of vascular loops present in the CV at 28 hpf. (C) The overall number of ECs in the caudal plexus (CA+CV) was assessed in controls and tnnt2a and pkd2 morphants at 28 hpf. Yellow arrowheads point to sprouting regions of the CV. Cell number was quantified in the caudal plexus of 28 hpf embryos and normalized per somite (between 6 and 11 embryos were imaged per condition; CA/V, caudal artery/vein). Error bars depict SEM. Statistical significance was determined by unpaired Student’s t test; p < 0.05, p < 0.01, p < 0.001. |
|
a. Kymographs of a single section (cmlc2:egfp, myocardium) in the developing heart tube are presented (asterisks indicate heart contraction). Graph displays quantification of the heart beat frequency in 24, 26 and 28 hpf embryos. b. 3D representation of beating hearts in Tg(fli:gal4FF; UAS:kaede; cmlc2:egfp) embryos. The heart myocardium is labeled in green (GFP), the endocardium and blood cells are in red (photoconverted kaede). The outflow tract region of the heart was further analyzed. Snapshot presents the axis and plane of section of the slice presented in c. Linear deformation of myocardium and endocardium was studied upon sectioning of the heart in the outflow tract region (b.) A kymograph analysis was performed on the resulting sections (1.04s) and linear deformation was quantified as shown in the scheme. See also Movie 5. d. 3D representation of the cardiac region and its associated vasculature in 24, 26 and 28 hpf Tg(fli:gal4FF; UAS:kaede; cmlc2:egfp) embryos. Heart myocardium is labeled in green (GFP), endocardium and blood cells are in red (photoconverted kaede). White arrows indicate direction of flow. LDA: Lateral Dorsal Aorta, AA: Aortic Arch. See also Movies 1 to 5. e. Flow mapping of the cardiovascular system of a 26 hpf embryo as shown in Fig.1h. Red-labeled blood cells were tracked over time and the tracks were color-coded for their instantaneous, mean and maximum velocity. Quantification is presented in Fig.1i. See also Movie 7. 

|
|
a. CLEM and electron tomography analysis of the venous cilium presented in Fig.2b,c,e. The cilium is located in the caudal vein of a 28 hpf embryo. A single tomogram spanning the celllumen interface is presented. Daughter and mother centrioles are in red, interconnecting fibers are in white, transition fibers are in yellow, plasma membrane is in green, microtubules are in red. The cilium contains five microtubules in the axoneme. b-d. CLEM analysis of the arterial cilium presented in Fig.2. b. Single TEM image of the region containing the cilium of interest (green boxed region, endothelium is in red, blood cells in blue). c. 3D modeling of the region of interest based on all the TEM micrographs containing the cilium of interest (d.) Note that the deflection angle of the cilium is conserved upon sample processing. See also Movie 10. (CA=Caudal Artery). e. Table showing al the cilia analyzed by electron tomography classified by genotype, stage, and vessel identity. Microtubule content, TEM images and 3D models are presented for both the basal body (proximal) and axoneme (distal) region of the cilia. Note the decrease in microtubule content in all the studied cilia. 

|
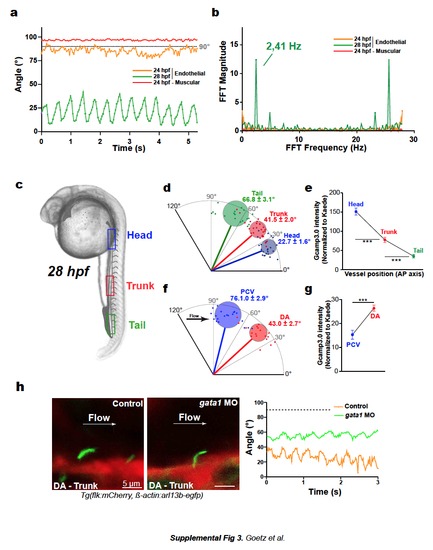
a. Deflection angles of the indicated cilium were plotted over time. b. Frequency analysis was performed using discrete Fourier transforms of ciliary movement. See also Movie 14. c-g. Cilia deflection and corresponding calcium content in three regions of the DA (d, e) and in the "trunk" region of the DA and PCV (f, g). h. Images and deflection angle analysis of cilia in 28 hpf embryos injected or not with gata1MO. See also Movie 17. |
|
a. Calcium content in the developing DA was quantified and images of tnnt2 morphants are provided. b. Calcium content in the DA was evaluated in 28 hpf cmlc1 morphants. c. Overall endothelial cell number was quantified in the indicated embryos. d. Calcium content in the developing DA was evaluated in pkd2 morphants. Quantification is shown in (a). e. Immunolocalization of PKD2 in the caudal plexus of Tg(β-actin:Arl13b-GFP). Expression of PKD2 is strong in membranes localized at the base of endothelial cilia in whole and dissected embryos. f. Vascular morphogenesis of the caudal vein was assessed in additional pkd2 morphants at 28 hpf. Asterisks point to vascular loops which are mostly absent in pkd2 morphants. 3D models of the vascular lumens of a delimited region (2 somites) of the caudal plexus was performed and are displayed as orthogonal and side views. The CA was colored in red and the CV in blue. Images are representative of between 3 and 8 embryos imaged per condition. Graph shows the number of vascular loops present in the CV at 28 hpf. g. Alternatively, vascular morphogenesis of the caudal vein was assessed in pkd2 morphants and cup (pkd2-/-) mutants (cuptc321) at 28 hpf using high-speed imaging of the blood flow. Maximum projections of the acquisitions reveal the anatomy of flow-carrying vessels in the caudal plexus (CA/V=Caudal artery/vein). Asterisks point to vascular loops which are mostly absent in pkd2 morphants and mutants. Graph shows the number of vascular loops present in the CV at 28 hpf. h. Experimental set-up for the stage and region-specific knockdown of pkd2 using a photo-cleavable sense morpholino. i. Images and 3D models of the vasculature at 28 hpf are provided. j. Graph shows the number of vascular loops present in the CV at 28 hpf. k. Flow velocities were measured upon high-speed imaging of blood cells in the caudal artery. Mean and maximum flow velocities were measured at 28 hpf. l. Calcium content in the developing DA was quantified and images are provided. m. Brightfield and fluorescent images of cilia number and localization in Tg(β-actin:arl13b-egfp) injected or not with ift88MO1 are shown. Similar results were obtained in embryos injected with ift88MO3 (not shown). n. Morphology of the caudal vein in control and ift88 morphants at 28 hpf. Asterisks point to vascular loops which are mostly absent in ift88 morphants. Graph shows the number of vascular loops present in the CV at 28 hpf. o. Overall endothelial cell number in the venous caudal plexus of 28 hpf Tg(fli1a:neGFP)y7 embryos and normalized per somite p. Calcium content in the developing DA using the endothelial-specific expression of Gcamp 3.0 in Tg(fli:gal4ff; UAS:gcamp3.0) embryos. q. Mean and maximum flow velocities at 28 hpf in the indicated embryos. r. Experimental set-up for the stage and region specific knockdown of ift88 using a photocleavable sense morpholino. s. Brightfield and fluorescent images of cilia number and localization, and of the vascular morphology (caudal plexus) at 28 hpf. t. Graphs show the number of vascular loops present in the CV (top panel), as well as calcium content in the developing DA after conditional knock-down (bottom panel), at 28 hpf. u. Mean and maximum flow velocities at 28 hpf in the indicated embryos. 

|