
- Title
-
Hyaluronic acid receptor Stabilin-2 regulates Erk phosphorylation and arterial--venous differentiation in zebrafish
- Authors
- Rost, M.S., Sumanas, S.
- Source
- Full text @ PLoS One
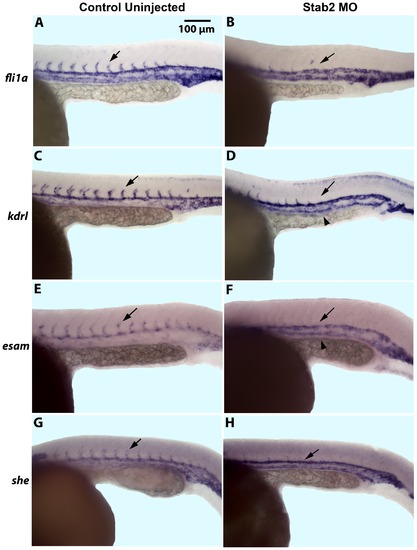
Stab2 morphants display a lack of intersegmental vessels. (A–H) In situ hybridization analysis shows a lack of ISVs in Stab2 morphants as observed by endothelial marker fli1a (A and B), kdrl (C and D), esam (E and F), and she (G and H) expression at 24 hpf, as compared to uninjected controls. Arrows indicate ISVs in control embryos and missing ISVs in morphants. Arrowheads indicate stronger PCV expression of kdrl and esam in morphant embryos (D and F). Lateral view, anterior is to the left; trunk and tail region is shown. Morphants were injected with a cocktail containing Stab2 MO1 and MO2, as well as p53 MO. ISVs: intersegmental vessels; PCV: posterior cardinal vein. |
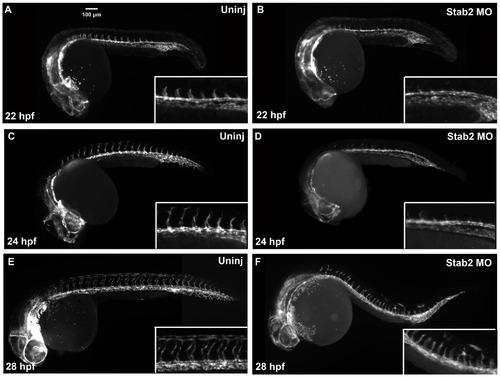
Stab2 morphants display ISV defects at 22–28 hpf. Tg(kdrl:GFP) expression in wild type uninjected embryos (A,C, and E) and Stab2 morphant embryos (B, D, and F) at 22 hpf (A,B), 24 hpf (C,D) and 28 hpf (E,F). Morphant embryos display absent (B and D) or reduced (F) ISVs at all three stages. Lateral view shown, anterior is to the left. Morphants were injected with a cocktail containing Stab2 MO1, MO2 and p53 MO. PHENOTYPE:
|
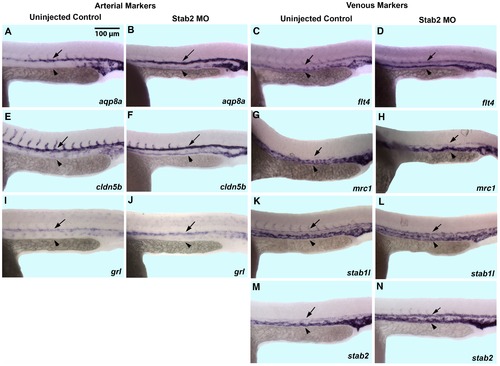
Stab2 morphants display expanded expression of certain arterial and venous markers. (A,B and E,F) As analyzed by in situ hybridization, aqp8a (A,B) and cldn5b (E,F) expression is restricted to the DA in wild type uninjected embryos while it is expanded into the PCV in Stab2 morphants at 24 hpf. (I,J) Arterial grl expression is not affected in Stab2 morphants. (C,D, G,H, and K,L) Expression of venous specific markers flt4 (C,D), mrc1 (G,H), and stab1l (K,L) is expanded into the area of the DA in Stab2 morphants. (M,N) Venous expression of stab2 itself is also expanded into the area of the DA at 24 hpf in Stab2 morphants. Arrows indicate DA and arrowheads indicate PCV. Lateral view, anterior is to the left, trunk and tail region is shown. DA: dorsal aorta; PCV: posterior cardinal vein. All embryos are 24 hpf. Morphants were injected with a cocktail containing Stab2 MO1, MO2 and p53 MO. EXPRESSION / LABELING:
|
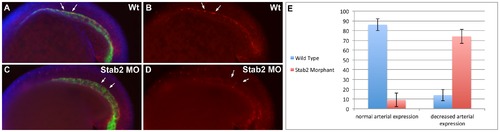
Stab2 knockdown affects Erk phosphorylation. (A–D) Phosphorylated Erk expression is observed in the DA of uninjected control embryos by whole mount immunostaining (A,B), while a majority of Stab2 morphants display a reduction in arterial P-Erk expression (C,D). (E) Percentages of embryos displaying normal or decreased arterial P-Erk expression. Arrows indicate P-Erk expression in the DA (A,C). Experiments performed in a Tg(fli1a:GFP) line. Green staining: GFP, Blue Staining: DAPI, Red staining: P-Erk. Lateral view, anterior is to the left. All embryos are at the 20-somite stage. Morphants were injected with a cocktail containing Stab2 MO1, MO2 and p53 MO. EXPRESSION / LABELING:
|
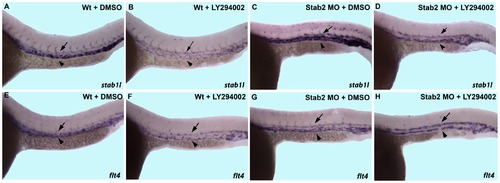
Downregulation of venous markers by PI3K inhibition is restored in Stab2 morphants. Both wild type and Stab2 morphant embryos were treated with either 1% DMSO or 20 µM LY294002 and stained for stab1l and flt4 expression by in situ hybridization analysis. (A,B, E,F) Wild type embryos display a reduction in intensity of staining of either stab1l (A,B) or flt4 (E,F) upon LY294002 treatment. Note that because venous stab1l and flt4 expression is reduced, arterial and venous expressions appear of similar intensity. (C,G) DMSO treated Stab2 morphants display an expansion of stab1l (C) and flt4 (G) expression into the area of the DA. (D,H) LY294002 treated Stab2 morphants display expanded arterial stab1l (D) and flt4 (H) expression and the intensity of venous expression are restored to wild type levels. Arrows indicate DA and arrowheads indicated PCV. Lateral view of 24 hpf embryos, anterior is to the left, trunk and tail region is shown. Morphants were injected with a cocktail containing Stab2 MO1, MO2, and p53 MO. |
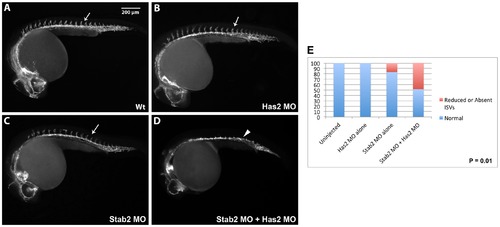
Stab2 and Has2 combinatorial knockdown results in a synergistic inhibitory effect on ISV formation. (A–C) A subphenotypic 1.25 ng dose of Stab2 (B) and 8 ng dose of Has2 (C) morpholinos do not affect vascular development when injected alone. (D) In contrast, Stab2 and Has2 MO co-injection results in 51 percent of embryos that lack ISVs suggesting that Stab2 and HA genetically interact. Arrows indicate ISVs. (E) Graph shows percentages of embryos displaying reduced or absent ISVs. Lateral view of 24 hpf embryos, anterior is to the left. PHENOTYPE:
|
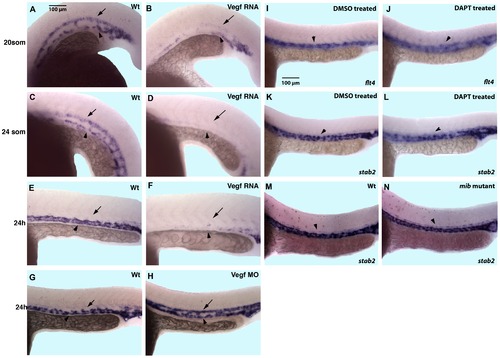
VEGF signaling inhibits stab2 expression, while Notch inhibition has no effect on stab2 expression. (A–F) Vegf overexpressing embryos display downregulated stab2 expression evident by in situ hybridization analysis at the 20-somite (A,B), 24-somite (C,D) and 24 hpf (E,F) stages. Note that in wt embryos stab2 is expressed in both the DA and the PCV at the 20–24-somite stage while its expression is primarily restricted to the PCV at 24 hpf. (G,H) Vegf morphants display an expansion of stab2 expression into the DA at 24 hpf when expression is normally restricted to the PCV in wt embryos. (I–N) Stab2 expression at 24 hpf is not affected by inhibition of Notch signaling either by DAPT treatment (K,L) or in mindbomb genetic mutants (M,N) while flt4 expression is expanded in DAPT treated embryos (I,J). Arrows indicate DA and arrowheads indicate PCV in all panels. Lateral view, anterior is to the left, trunk and tail region is shown. |
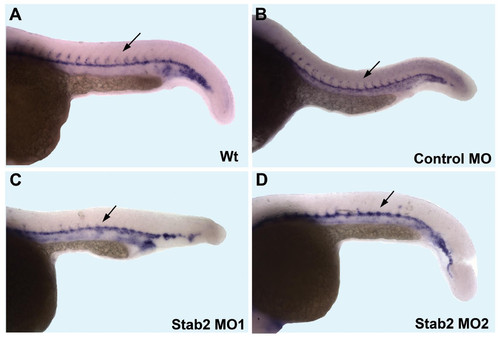
Two different Stab2 morpholinos result in similar phenotypes. (A–D) In situ hybridization analysis shows kdrl RNA expression at 24 hpf in wild type uninjected (A), standard control morpholino injected (B) and embryos injected with two different Stab2 translation blocking morpholinos (C and D). Kdrl expression was unaffected by control morpholino injection. Stab2 morphants display a lack of ISVs. Embryos were microinjected with 3.75 ng of a standard control morpholino, 7.5 ng of Stab2 MO1, or 2.5 ng of Stab2 MO2. Arrows indicate ISVs (A and B) or missing ISVs (C and D). PHENOTYPE:
|
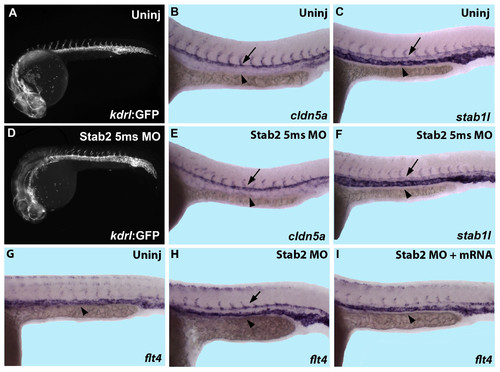
Specificity of Stab2 MO knockdown phenotype demonstrated by control 5 base pair mismatch Stab2 MO injection and a partial rescue by stab2 mRNA injection. (A,D) Morphant embryos do not display any apparent reduction in ISVs by Tg(kdrl:GFP) expression at 24 hpf when injected with a 5 base pair mismatch Stab2 morpholino (Stab2 5 ms MO). (B,C,E,F) Stab2 5 ms MO-injected embryos show normal arterial cldn5a (B,E) and venous stab1l (C,F) expression. (G–I) Venous expansion of flt4 is apparent in Stab2 morphant embryos (H) as compared to uninjected controls (G), but is rescued by coinjection with stab2 mRNA (I). Lateral view of 24 hpf embryos shown, anterior is to the left. Morphants were injected with a cocktail containing 3.75 ng Stab2 5 ms MO+3.75 ng p53 MO (D–F), 3.75 ng Stab2 MO+3.75 ng p53 MO (H), or 3.75 ng Stab2 MO, 3.75 ng p53 MO and 160 pg stab2 mRNA (I). Arrows indicate DA and arrowheads indicate PCV in all panels. |
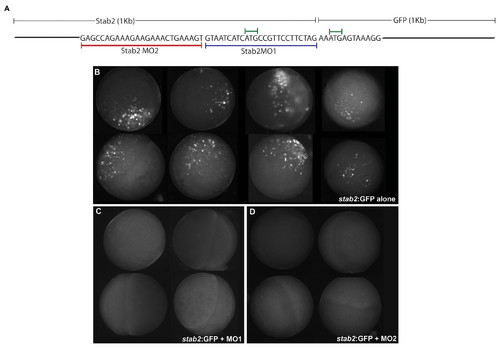
Stab2 morpholino disrupts Stab2 promoter driven GFP expression. (A) Depiction of the stab2:GFP fusion construct created for injection. A 1 kb segment of stab2 upstream promoter/52UTR sequence containing both morpholino sites (red and blue lines) and the translation start site (green line) was fused to the GFP coding region. (B) Embryos display mosaic GFP expression when injected with 40 pg of the stab2:GFP construct described in A. (B and C) This expression is downregulated when stab2 MO1 (C) or MO2 (D) are coinjected with stab2:GFP. Panels consist of a composite of representative embryos from each injection group at the 50% epiboly stage. (B) 29 out of 40 embryos express GFP. (C) 1 out of 23 embryos expressed GFP. (D) 1 out of 30 embryos expressed GFP. |