
- Title
-
Wnt-regulated dynamics of positional information in zebrafish somitogenesis
- Authors
- Bajard, L., Morelli, L.G., Ares, S., Pécréaux, J., Jülicher, F., Oates, A.C.
- Source
- Full text @ Development

Reduction of Wnt signaling during trunk somitigenesis using hsdkk1 transgene preserves elongation and increases somite length. hsdkk1::GFP heterozygote outcross. (A-D) Posterior elongation and instantaneous somite length over time, showing a representative experiment with heat shock at <9 somites; n=8 per condition. Lateral view of representative heat shocked (hs) wild-type (WT) control (A) or transgenic (B) embryo, with magnification of the last three somites formed (A2,B2) when the tenth somite post-heat shock (phs) forms. (C) Plot of distance between fixed position in somites and posterior tip (white line in A,B) over time. (C2) Elongation rate, 190-430 minutes phs. (D) Box plot of instantaneous somite length (distance between consecutive notches, orange line in A2,B2). (E,F) Dorsal view of flat-mounted anterior PSM of control or transgenic embryo double-stained for mespb (blue) and myoD (red), fixed 4 hours phs. Black arrow indicates the last-formed somite. (G) Segment length (distance between two mespb stripes, white arrow in E,F) in embryos fixed every 30 minutes after heat shock, starting 2.5 hours phs. Mean ± s.d. *P<0.01, **P<0.001; ns, not significant. Scale bars: 50 µm. See also Fig. S1, Table S1, Movies 1-3. EXPRESSION / LABELING:
PHENOTYPE:
|

Wnt inhibition shifts the position of molecular markers of the wavefront posteriorly <6 somites after heat shock. (A-D,F-I) Dorsal view of flat-mounted hsWT (A,B,F,G) or hsdkk1 (C,D,H,I) PSM heat shocked at six somites (A-D) or one somite (F-I), fixed 3.5 hours phs and hybridized with mespb (A-D) or her7 (F-I) probes. (E,J) Normalized distance between posterior mespb stripe (E) or anteriormost her7 stripe (J) and the posterior end of the notochord (black arrows in A-D,F-I) at successive time points. Mean ± s.d. *P<0.01, **P<0.001. Scale bars: 50 µm. See Fig. S2. EXPRESSION / LABELING:
|

A posterior gradient of Wnt activity is reduced <∼2 somites after heat shock. (A,B,E-H) Dorsal view of flat-mounted non-heat shocked (A,B), hsWT (E,G) or hsdkk1 (F,H) PSM at nine (G,H), ten (A,E,F) or 12 (B) somites. Embryos were fixed 30 minutes (E,F) or 1.5 hours (G,H) phs. (A) Fluorescence intensity of β-catenin staining after applying a nuclear mask, displayed using false color. (B) Whole-mount in situ hybridization with mespb (blue) and myoD (red) probes. (C,D,I,J) Nuclear intensity of β-catenin staining (C, percentage of maximum; D,I,J, grayscale values) along the PSM length for individual cells, for one embryo (C) or averaged within 1.5% bins for several embryos (D,I,J). Error bars reflect variation between embryos. The average mespb intensity profile is in purple in D. (K) Maximum intensity nuclear β-catenin normalized to hsWT dynamic range, with embryos fixed at successive time points. Mean ± s.d. *P<0.01, **P<0.001. Scale bars: 50 μm. See also supplementary material Figs S3, S4. EXPRESSION / LABELING:
|

Fgf activity is weakly reduced <7 somites after heat shock. (A-D) Lateral view of hsdkk1::GFP (B,D) or WT siblings (A,C) heat shocked at eight somites, fixed 2.5 hours phs and hybridized with fgf3 (A,B) or fgfr1 (C,D) riboprobes. (E-H) Dorsal view of flat-mounted PSM from hsdkk1::GFP (F,H) or WT siblings (E,G) heat shocked at eight somites, fixed 2.5 hours phs and hybridized with pea3 (E,F) or erm (G,H) riboprobes. Dashed outline indicates domain of expression elevated in hsdkk1 embryos. (I) Confocal section of flat-mounted PSM of 10-somite stage WT immunostained with dpErk antibody. (J) Average gray value intensity profile of dpErk signal in 10-somite stage WT embryos. (K,L) hsdkk1::GFP or WT siblings, heat shocked at six somites and fixed 2 (K) or 3.5 (L) hours phs, showing percentage of dpErk signal relative to hsWT dynamic range. (M,N) Time series after heat shock of maximum intensity (M) or logEC50 (N) from plots of dpErk signal normalized to hsWT. Mean ± s.d. *P<0.01. EXPRESSION / LABELING:
|
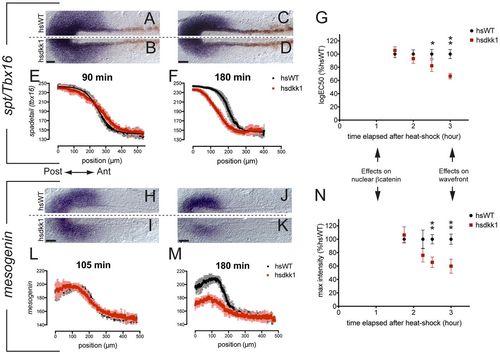
Wnt target gene expression is reduced four to five somites after heat shock. (A-D,H-K) Dorsal view of flat-mounted PSM from hsdkk1::GFP (B,D,I,K) or WT siblings (A,C,H,J) heat shocked at five (A-D) or six (H-K) somites, fixed 1.5 (A,B), 1.75 (H,I) or 3 (C,D,J,K) hours phs and hybridized with spt (A-D) or msgn1 (H-K) riboprobes. (E,F,L,M) Average intensity profile for spt (E,F) and msgn1 (L,M) along the A/P axis. (G) Normalized logEC50 calculated from fitting plots of spt intensity profile at successive time points. (N) Maximum intensity of msgn1 normalized to hsWT dynamic range at successive time points. Mean ± s.d. *P<0.01, **P<0.001. Scale bars: 50 µm. EXPRESSION / LABELING:
|
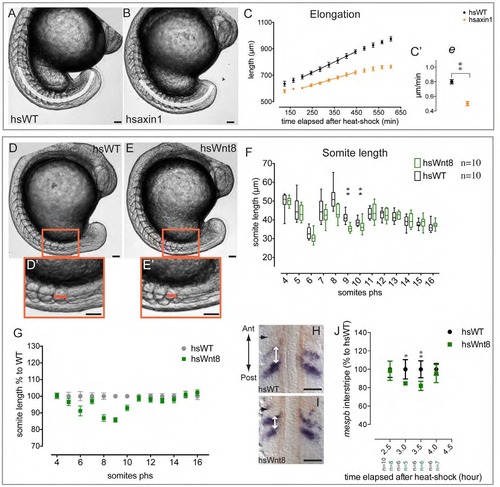
Effect of expression of hsaxin1 on elongation and of hsWnt8 on somite length, related to Figure 1. (A-C′) hsaxin1::YFP heterozygote outcross. (D-J) hsWnt8::GFP heterozygote outcross. (A,B,D,E) Lateral view of representative control (A,D) or transgenic (B,E) embryo when the 9th somite (A,B) or 10th somite (D,E) after the heat-shock is forming. (D′,E′) Close-up of the 3 last formed somites. (C) Mean ± SD of distance between a fixed position in the somites and the posterior tip of the embryo (white line in A,B) over time. (C′) Slope of the linear fit indicated in C. (F) Box plot of somite length (distance between two consecutive notches, orange line in D′,E′) measured from an experiment in which the heat-shock was performed at 6 somites ; n=10 per condition. (G) Normalized mean somite length ± SEM measured from 4 experiments. (H,I) Dorsal view of the anterior PSM of control (H) or transgenic (I) embryos double stained for mespb (blue) and MyoD (red), fixed 3.5 h (~7 somites) after heatshock. (J) Mean ± SD of segment length, the distance between the anterior margins of two mespb stripes measured as indicated with white arrows in H, I, on embryos fixed at successive time points after heat-shock. * p<0.01, ** p<0.001. EXPRESSION / LABELING:
PHENOTYPE:
|
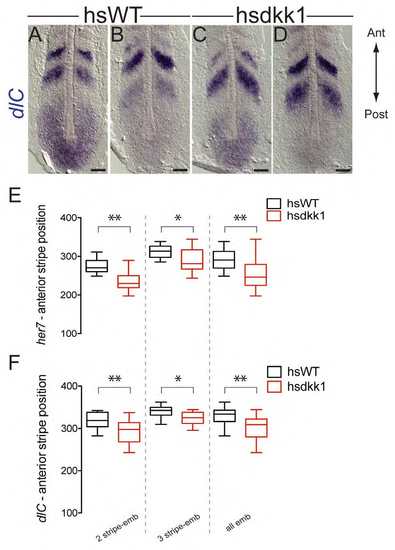
Effect of Wnt inhibition on dlC and her7 expression at ~7 somites phs, related to Figure 3. (A-D) Dorsal views of flat-mounted PSM from hsdkk1::GFP (C,D) or their WT siblings (A,B) heat-shocked at 2 somites, fixed 3.5 h phs and stained for dlC. (E,F) Box Plot of the distance between anterior-most stripe of her7 (E) or dlC (F) and the posterior end of the notochord measured from embryos displaying 2 stripes or 3 stripes or both. * p<0.01, ** p<0.001. Scale bar 50µm. |

Intensity profiles of axin2 and notail (ntl) along normalized antero-posterior PSM length, related to Figure 4. (A,B) Dorsal view of flat mounted PSM of wild-type embryos at 12 (A) or 10 (B) somites, stained for axin2 and mespb (A) or ntl and mespb (B). (C,D) Average intensity profiles from several embryos obtained from color-inverted pictures, within a line of interest that spans the PSM (see black arrows in A and B). The grey shading indicates the width of the Line of Interest used for measurements. Mean ± SD. Scale bar is 50µm. |
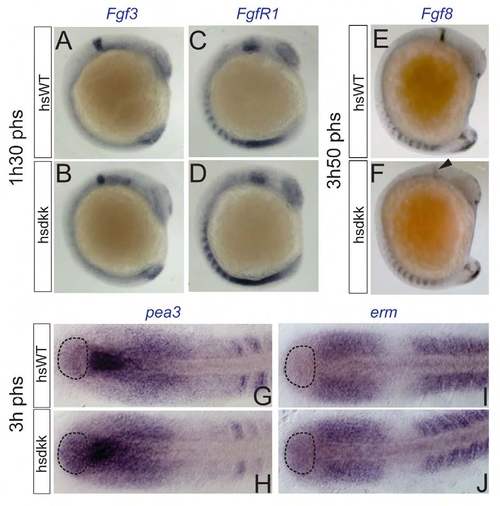
Expression of Fgf pathway members after Dkk overexpression, related to Figure 5. (A-F) Lateral view of hsdkk1::GFP (B,D,F) embryos or WT siblings (A,C,E) heat-shocked at 8 (A-D) or 6 (E,F) somites, fixed 1.5 h (A-D) or 3.8 h (E,F) phs and hybridized with fgf3 (A,B), fgfr1 (C,D) or fgf8 (E,F) probes. Arrowhead shows domain of reduced fgf8 expression in mid-hindbrain boundary. (G-J) Dorsal view of flat mounted PSM of hsdkk1::GFP (H,J) or WT siblings (G,I) heat-shocked at 8 somites, fixed 3 h phs and hybridized with pea3 (G,H) or erm (I,J) probes. Dashed outline indicates domain of expression elevated in hsdkk1 embryos. |