
- Title
-
Pten regulates homeostasis and inflammation-induced migration of myelocytes in zebrafish
- Authors
- Dong, Z.W., Ren, C.G., Xia, Y., Su, D., Du, T.T., Fan, H.B., Yuan, H., Wang, L., Dong, M., Li, W.C., Jin, Y., Chen, Y., Deng, M., Liu, T.X., Gu, A.H., Zhou, Y.
- Source
- Full text @ J. Hematol. Oncol.
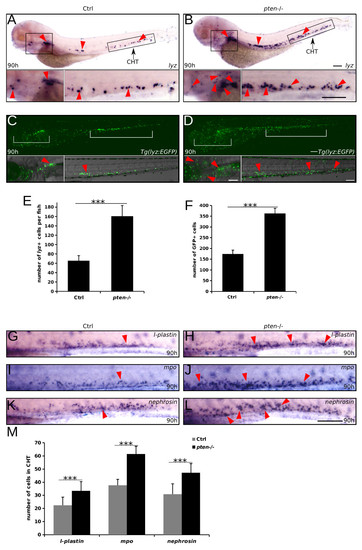
Definitive myelopoiesis is strongly expansive in pten-deficient embryos. (A-B) Whole-mount in situ hybridization analyses of definitive myelopoiesis with riboprobes for lyz in the indicated embryos at 90 hpf. The lower panels are high-magnification views of the indicated region in the upper panel. The red arrowheads indicate myeloid cells in the CHT and kidney/thymus region. (C-D) The pten-/-lyz:EGFP embryos show increased EGFP-positive myeloid cells. The red arrowheads indicate EGFP-positive cells in the CHT and kidney region. The embryos are shown in lateral views with the anterior to the left. e: eye. (E-F) Statistical result for a, b and c, d respectively. (G-M) Whole-mount in situ hybridization analyses for other myeloid markers (l-plastin, mpo, nephrosin) in the CHT. The red arrowheads indicate the myeloid cells marked by each probe. The data shown in (E-F) and (M) are the means ± SEM of at least 30 embryos; ***p < 0.001 versus the control. Scale bar: 100 μm. EXPRESSION / LABELING:
PHENOTYPE:
|
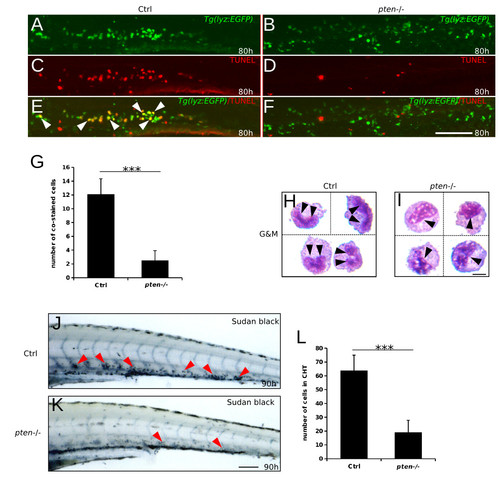
Reduced apoptosis and block in myeloid cell maturation underlie pten deficiency-induced expansive myelopoiesis. (A-G) Double staining of lyz-driven EGFP protein and TUNEL assay in the CHT of control and pten-/- embryos at 80 hpf. Although relative more EGFP-positive myeloid cells were observed in the pten-/- embryos (A and B, all green cells were manually counted as positive), few cells were simultaneously apoptotic, as indicated by merging with TUNEL staining (E and F, white arrowheads). (H and I) Wright-Giemsa staining and morphological characterization of FACS-purified EGFP-positive cells from 90 hpf pten-/-lyz:EGFP and control embryos. The black arrowheads indicate the nuclear shape, which was typically kidney-like and condensed in control embryos (H) but remained in a loose state in the pten-/- embryos (I). (J-L) Sudan Black staining of neutrophils at 90 hpf. The red arrowheads indicate neutrophils in the CHT. The data shown in (G) and (L) are the means ± SEM of at least 15 and 30 embryos; ***p < 0.001 versus the control. Scale bar: h and i, 5 um; others, 100 μm. EXPRESSION / LABELING:
PHENOTYPE:
|
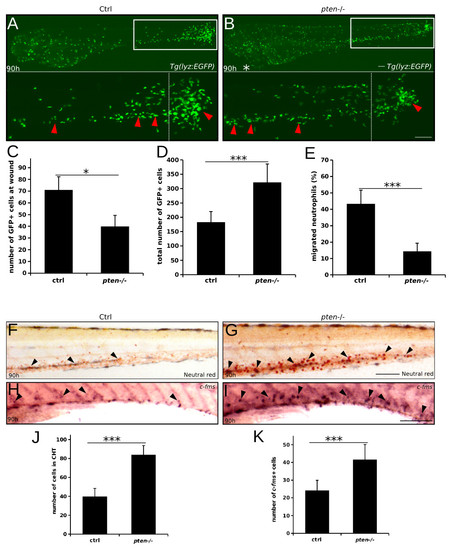
The immune response of expansive myeloid cells is impaired in pten-/- embryos. (A and B) Tail transection analyses of myeloid cell movement in response to inflammation. The myeloid cells of the control and pten-/- embryos moved to the wound site at 6 hours post-transection (hpt) (90 hpf) (A and B, white boxes). The red arrowheads indicate the myeloid cells away from the wound (A and B, left region of the lower panels) and the myeloid cells that arrived at the wound (A and B, right region of the lower panels). A white asterisk indicates the heart edema of pten-/- embryos. (C-E) Quantification of myeloid cells in the region to the right of the white dashed line (A and B, lower panel) (C) and the total number of myeloid cells (D) in each embryo. (E) The percentage of myeloid cells that migrated to the wound. (F and G) Neutral Red staining of macrophages at 90 hpf. The black arrowheads indicate macrophages in the CHT. (H and I) Whole-mount in situ hybridization analyses of macrophages with riboprobe for c-fms. The black arrowheads indicate macrophages in the CHT. (J and K) Statistical results of F, G and H, I respectively. The data shown are the means ± SEM of at least 30 embryos; ***p < 0.001 versus the control. Scale bar: 100 μm. EXPRESSION / LABELING:
PHENOTYPE:
|

The PI3K/mTOR pathway contributes to the expansion of definitive myelopoiesis in pten-/- embryos. (A-L) Whole-mount in situ hybridization analyses of lyz-positive myeloid cells in embryos treated with increasing doses of LY294002 (LY) or rapamycin (Ra) at 90 hpf. Untreated and mock-treated pten-/- embryos (B, C and H, I) showing expansive myelopoiesis compared to the controls (A and G), as mentioned above. The pten-/- embryos treated with stepwise increases in LY294002 or rapamycin showed an obvious rescue effect, as indicated by the decrease in myeloid cells (D-F and I-L). The red arrowheads indicate the main positions of the myeloid cells. (M and N) Quantification of myeloid cells in each embryo (a-l). The data shown are the means ± SEM of at least 30 embryos, *p < 0.05, **p < 0.01, ***p < 0.001 versus the corresponding controls. Scale bar: 100 μm. EXPRESSION / LABELING:
PHENOTYPE:
|
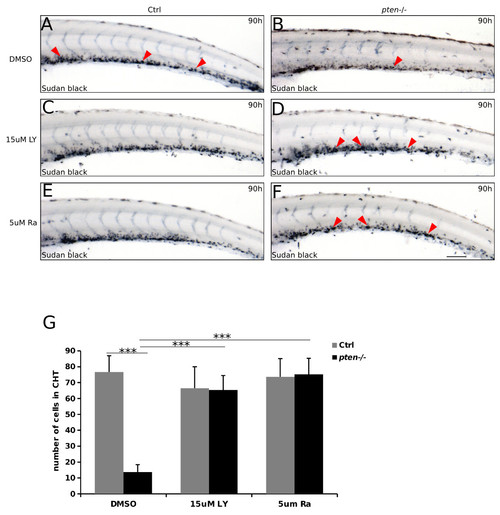
The PI3K/mTOR pathway contributes to the blockage of myeloid cell maturation in pten-/- embryos. (A-F) Sudan Black staining of neutrophils at 90 hpf. Control and pten-/- embryos were treated with DMSO (A-B) or LY294002/Rapamycin (C-D and E-F) at indicated concentration. The red arrowheads indicate neutrophils in the CHT. (G) statistical results of A-F. The data shown in (G) are the means ± SEM of at least 30 embryos; ***p < 0.001 versus the control. Scale bar: 100 μm. PHENOTYPE:
|

The overexpression of C/ebpα ameliorates expansive myelopoiesis in pten-deficient embryos. (A) The expression level of cebpa was negatively related to the number of myeloid cells. Real-time quantitative PCR of cebpa in EGFP-positive myeloid cells from pten-/-lyz:EGFP and control embryos was performed every 6 hours from 72 to 102 hpf (solid line and left Y-axis). The lyz-positive myeloid cells in each embryo were counted via the whole-mount in situ hybridization analyses of embryos at 72 to 102 hpf (dashed line and right Y-axis). The indicated value is the ratio of pten-/- to control myeloid cells. (B-E) Whole-mount in situ hybridization analyses for lyz in embryos injected with in vitro-synthesized control (B and C) or cebpa(D and E) mRNA at the one-cell stage. The overexpression of cebpa mRNA largely rescues expansive myelopoiesis in pten-/- embryos. The red arrowheads indicate expansive myelopoiesis in the mock-injected pten-/- embryos and the decrease in myeloid cells in the cebpa-injected pten-/- embryos. (F-I) Sudan Black staining of neutrophils in embryos injected with control (F and H) or cebpa (G and I) mRNA. The red arrowheads indicate neutrophils in the CHT. (J and K) Quantification of myeloid cells in each embryo (B-E and F-I). The data shown are the means ± SEM of at least 30 embryos; *p < 0.05, **p < 0.01, ***p < 0.001 versus the corresponding controls. Scale bar: 100 μm. |