
- Title
-
Pitx2c ensures habenular asymmetry by restricting parapineal cell number
- Authors
- Garric, L., Ronsin, B., Roussigné, M., Booton, S., Gamse, J.T., Dufourcq, P., Blader, P.
- Source
- Full text @ Development
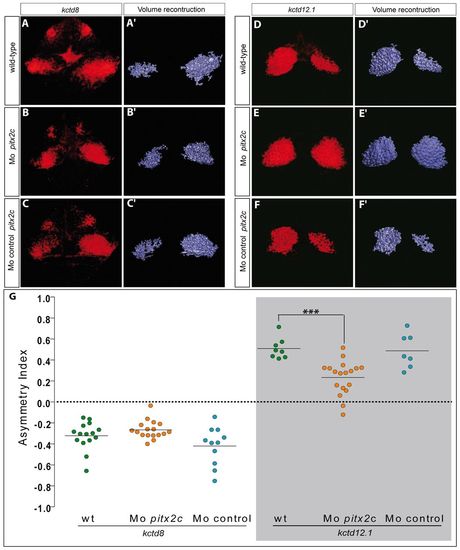
Partial left isomerisation in pitx2c morphants. (A-C) Single confocal sections of the epithalamus showing in situ hybridisation against kctd8 in wild-type, pitx2c morphant and control morphant embryos at 72 hpf. No differences are detected between the different contexts. (A2-C2) Three-dimensional renderings of volumes of kctd8 expression in the habenulae of the respective confocal acquisition sets. (D-F) Single confocal sections of the epithalamus showing in situ hybridisation against kctd12.1 in wild-type, pitx2c morphant and control morphant embryos at 72 hpf. pitx2c morphants display broader expression of kctd12.1 in the right habenula than either of the control contexts. (D2-F2) Three-dimensional renderings of volumes of kctd12.1 expression in the habenulae of the respective confocal acquisition sets. (G) Asymmetry index (AI) with regard to the volumes of kctd8 or kctd12.1 expression for individual wild-type (wt), control or pitx2c morphant embryos. Horizontal black line represents the median AI for each context and the dotted line indicates symmetry. Only the AI for the expression of kctd12.1 in pitx2c morphants is significantly more symmetric than control conditions; ***P<0.001 using a t-test. Embryos are viewed dorsally with the anterior to the top. EXPRESSION / LABELING:
PHENOTYPE:
|
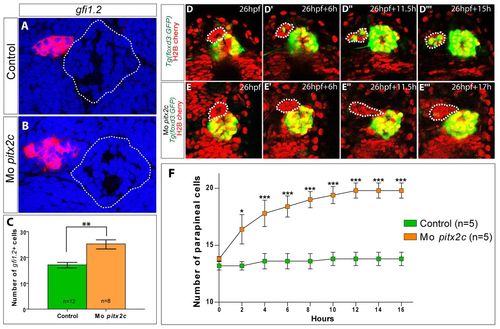
pitx2c morphants display larger parapineals. (A,B) Single confocal sections of the pineal complex showing in situ hybridisation against gfi1.2 in control and pitx2c morphant embryos at 72 hpf. The outline of the pineal gland is highlighted with a dotted line. (C) Counts of cell expressing gfi1.2 in control and pitx2c morphants. The number of gfi1.2-positive cells is significantly increased in the morphant context; **P<0.01 using a t-test. Error bars represent s.e.m. (D-D22) Single confocal sections extracted from a time-lapse series showing the migrating parapineal (indicated with a dotted line) in a Tg(foxd3:GFP)zf15 embryo; nuclei are labelled in red with Histone2B:RFP. At 24 hpf (D), the parapineal has only just delaminated from the anterior region of the pineal complex. Leftward migration is clearly engaged at 6 hours (D2) and continues throughout the analysis (D2,D22). Time after the initiation of the analysis is indicated on each frame. (E-E22) Single confocal sections extracted from a time-lapse series showing the migrating parapineal (indicated with a dotted line) in a pitx2c morphant embryo carrying the Tg(foxd3:GFP)zf15 transgene; nuclei are labelled in red with Histone2B:RFP. As in wild-type siblings, pitx2c morphant parapineals have migrated to the left at 6 hours. Time after the initiation of the analysis is indicated on each frame. (F) Numbers of cells in the parapineal during migration in wild-type (green) and pitx2c morphant embryos (orange). A statistically significant difference in parapineal cell numbers is detected in the morphant versus the control as early as 2 hours into the time-lapse datasets. *P>0.1; ***P<0.0.001 using a two-way repeated measures ANOVA test. Error bars represent s.e.m. Embryos are viewed dorsally with the anterior towards the top. EXPRESSION / LABELING:
PHENOTYPE:
|
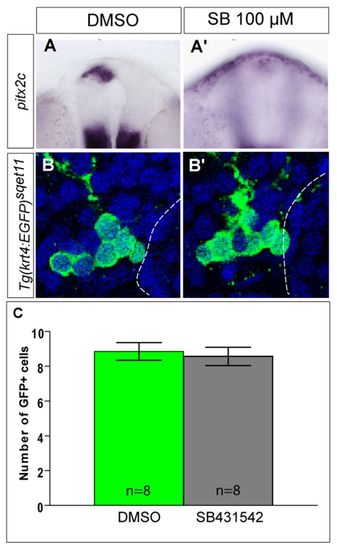
Parapineal cell numbers are unaffected in the absence of epithalamic Nodal signalling. (A,A2) Frontal view of the epithalamus showing in situ hybridisation against pitx2c at 24 hpf in mock-treated embryos (A) or those treated with 100 μM SB431542 (A2). (B,B2) Single confocal sections of the parapineal showing the expression of GFP from the Et(krt4:EGFP)sqet11 transgene in mock-treated embryos (B) or those treated with 100 μM SB431542 (B2). The outline of the pineal gland is highlighted with a dotted line. (C) Counts of cell expressing the Et(krt4:EGFP)sqet11 transgene in mock-treated and SB431542-treated embryos. The number of GFP-positive cells is unaffected by treatment with SB431542. Error bars represent s.d. EXPRESSION / LABELING:
|

Suboptimal Nodal signalling reduces parapineal cell number. (A-D) Single confocal sections of the pineal complex showing in situ hybridisation against gfi1.2 in mock-treated, 50 μM SB431542-treated, mock-treated/pitx2c morphant and 50 μM SB431542-treated/pitx2c morphant embryos at 72 hpf. The outline of the pineal gland is highlighted with a dotted line. (E) Counts of cells expressing gfi1.2 in mock-treated and SB431542-treated embryos. The number of gfi1.2-positive cells is significantly decreased only when embryos are treated with 50 μM SB431542; ***P<0.0.001 using a t-test. Error bars represent s.e.m. (F) Counts of cells expressing gfi1.2 in mock-treated and SB431542-treated embryos injected with pitx2c morpholino. Whereas DMSO-treated morphant embryos leads to an increase in parapineal cell number, morphants embryos treated with 50 μM of SB431542 display wild-type numbers of parapineal cells; *P<0.05, ***P<0.0.001 using a t-test. Error bars represent s.e.m. (G) Model for the antagonism between Nodal and Pitx2c. Whereas Nodal activates pitx2c expression that subsequently limits parapineal cell numbers, in parallel a second target of Nodal signalling (X) promotes an increase in parapineal cell numbers. The balance between these two Nodal effectors provides fine control over the maximum cell number of the parapineal. EXPRESSION / LABELING:
PHENOTYPE:
|
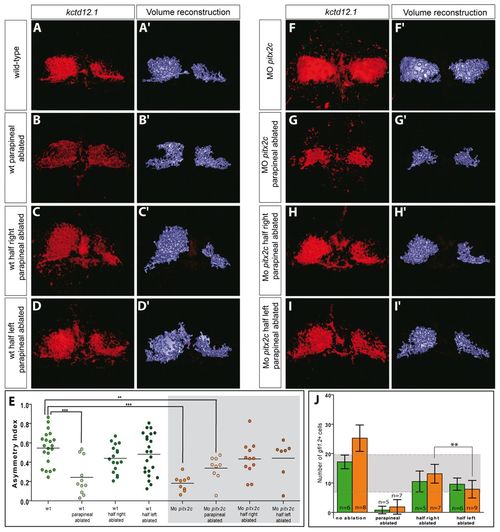
Restricting parapineal cell number rescues habenular asymmetry. (A-D) Single confocal sections of the epithalamus showing in situ hybridisation against kctd12.1 in wild-type embryos at 72 hpf with no ablation (A), complete parapineal ablation (B) or partial ablation of the right (C) or left (D) half of the parapineal anlage. Although complete parapineal ablation induces right isomerisation of kctd12.1 expression, no differences are detected in partial ablations. (A2-D2) 3D renderings of volumes of kctd12.1 expression in the habenulae of the respective confocal acquisition sets. (E) Asymmetry index (AI) with regard to the volume of kctd12.1 expression for individual wild-type (wt) or morphant embryos with complete or partial parapineal ablations. Horizontal black line represents the median AI for each context. Although complete ablation of the parapineal renders the expression of kctd12.1 significantly less asymmetric, partial ablation in pitx2c morphants restores asymmetry; **P<0.01; ***P<0.001 using a t-test. (F-I) Single confocal sections of the epithalamus showing in situ hybridisation against kctd12.1 in pitx2c morphant embryos at 72 hpf with no ablation (F), complete parapineal ablation (G) or partial ablation of the right (H) or left (I) half of the parapineal anlage. Although pitx2c morphants display left isomerisation of kctd12.1 expression and complete parapineal ablation induces right isomerisation, partial ablations return the expression pattern of kctd12.1 to a wild-type pattern. (F2-I2) 3D renderings of volumes of kctd12.1 expression in the habenulae of the respective confocal acquisition sets. (J) Counts of cells expressing gfi1.2 in control (green) and pitx2c morphant (orange) embryos having undergone no ablation, complete parapineal ablation or partial ablation of the right or left half of the parapineal anlage immediately prior to parapineal migration. Partial ablations in pitx2c morphants produce residual parapineals whose cell counts falls within the range sufficient for imposing correct habenular asymmetry in wild-type embryos (highlighted in grey). Although left and right partial ablation in wild-type embryos produces residual parapineals with similar numbers of cells, significantly more parapineal cells remain after partial right than partial left ablations in pitx2c morphants. Error bars represent s.d; **P<0.01 using a t-test. Embryos are viewed dorsally with the anterior towards the top. EXPRESSION / LABELING:
PHENOTYPE:
|
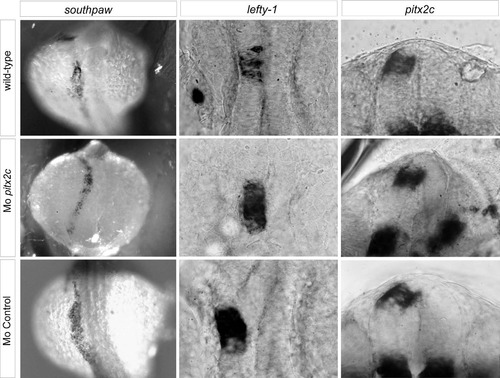
No changes are detected in the expression of the Nodal family gene southpaw in the left lateral plate mesoderm at 18 hpf, or in the expression of pitx2c and the Nodal feedback inhibitor lefty1 in the left dorsal diencephalons at 24 hpf in pitx2c morphants relative to wild-type and control morphants suggesting that the establishment of L/R asymmetry is not generally affected. |
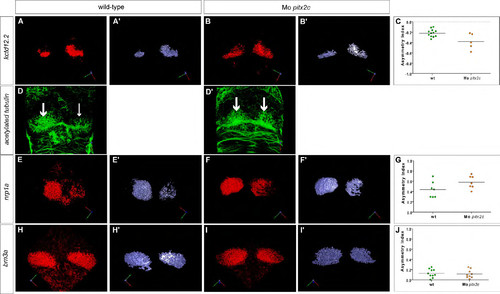
(A, B) Single confocal sections of the epithalamus showing in situ hybridisation against kctd12.2 in wild-type and pitx2c morphant embryos at 72 hpf. (A′, B′) 3D renderings of volumes of kctd12.2 expression in the habenulae of the respective confocal acquisition sets. (C) Asymmetry index (AI) with regard to the volume of kctd12.2 expression for individual wild-type or pitx2c morphant embryos. Horizontal black line represents the median AI for each context: note that the AI is negative because the asymmetry is biased to the right. No significant difference between wild-type or pitx2c morphant embryos is detected. (D, D′) Single confocal sections through the epithalamus showing the habenular neuropil detected by immunostaining against acetylated tubulin at 72 hpf. While the neuropil of wild-type embryos is asymmetric with a left bias (large versus small arrows), symmetric anti-acetylated tubulin staining is detected in pitx2c morphant embryos (two large arrows). (E, F) Single confocal sections of the epithalamus showing in situ hybridisation against nrp1a in wild-type and pitx2c morphant embryos at 72 hpf. (E′, F′) 3D renderings of volumes of nrp1a expression in the habenulae of the respective confocal acquisition sets. (G) Asymmetry index with regard to the volume of nrp1a expression for individual wild-type or pitx2c morphant embryos. Horizontal black line represents the median AI for each context. No significant difference between wild-type or pitx2c morphant embryos is detected. (H, I) Single confocal sections of the epithalamus showing in situ hybridisation against brn3a in wild-type and pitx2c morphant embryos at 72 hpf. (H′, I′) 3D renderings of volumes of brn3a expression in the habenulae of the respective confocal acquisition sets. (J) Asymmetry index with regard to the volume of brn3a expression for individual wild-type or pitx2c morphant embryos. Horizontal black line represents the median AI, which are in both contexts close to zero reflecting that they are virtually symmetric. No significant difference between wild-type or pitx2c morphant embryos is detected. Embryos are view dorsally with the anterior to the top. |
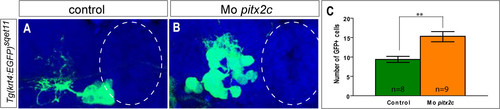
(A,B) Confocal projections showing the expression of GFP from the Et(krt4:EGFP)sqet11 transgene in control and pitx2c morphant embryos at 72 hpf. The outline of the pineal gland is highlight with a dotted line. (C) Counts of cell expressing GFP in control and pitx2c morphants. The number of GFP-positive cells is significantly increased in the morphant context; **P<0.01 using a t-test. Error bars represent s.d. |
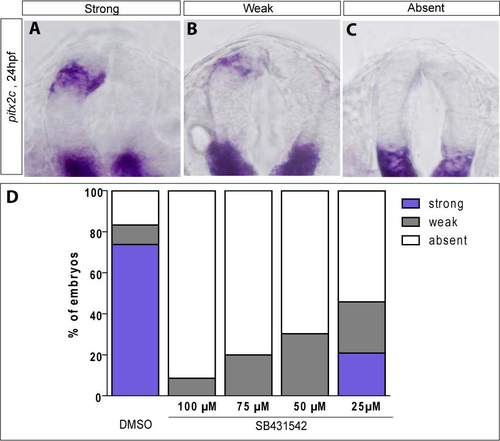
(A-C) Frontal view of the epithalamus showing in situ hybridisation against pitx2c at 24 hpf. Expression can be qualified as Strong (A), Weak (B) or Absent (C). (D) Quantification of pitx2c expression classes presented in (A-C) in mock-treated and embryos treated with varying concentrations of SB431542 from 16 to 72 hpf . |