
- Title
-
Hypoxia-inducible factor 3 is an oxygen-dependent transcription activator and regulates a distinct transcriptional response to hypoxia
- Authors
- Zhang, P., Yao, Q., Lu, L., Li, Y., Chen, P.J., Duan, C.
- Source
- Full text @ Cell Rep.
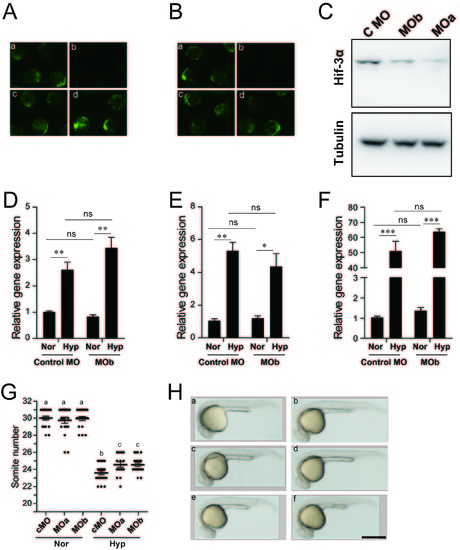
A) MOa specifically knocked down Hif-3α. Zebrafish embryos were injected with hif-3α- UTR:GFP DNA alone (panel a), hif-3α-UTR:GFP DNA together with MOa (panel b) or control MO (panel c). In panel d, zebrafish embryos were injected with MOa together with a hif-3-UTR:GFP(-MOa) plasmid with the targeting sequence mutated. GFP expression was analyzed by fluorescent microscopy at 12 hpf. Scale bar = 0.5 mm. B) MOb specifically knocked down Hif- 3α. Zebrafish embryos were injected with hif-3α-UTR:GFP DNA alone (panel a), hif-3α- UTR:GFP DNA together with MOb (panel b) or control MO (panel c). In panel d, zebrafish embryos were injected with MOb together with a hif-3α-UTR:GFP plasmid with the targeting sequence mutated. GFP expression was analyzed by fluorescent microscopy at 12 hpf. C) Knockdown of endogenous Hif-3α by MOa and MOb. Embryos injected with MOa, MOb, and control MO were raised to 12 hpf under hypoxia. The embryos were lysed and subjected to western immunoblot using the indicated antibodies. D-F) Knockdown of Hif-3α has no effect on the hypoxic induction of glut1 (D), vegfAb (E), and igfbp1a (F) expression in zebrafish embryos. Control MO or hif-3α targeting MOb-injected embryos were raised in normoxic (Nor) or hypoxic (Hyp) water and sampled at 12 hpf. The mRNA levels of the above mentioned Hif-1 target genes were determined by qRT-PCR and normalized by the β-actin levels. n = 3, all data shown are means + SEM, *, **, and ***, P < 0.05, 0.01, and 0.001; ns, not significant. G) Knockdown of Hif-3α alleviates hypoxia-induced growth and developmental retardation. Control MO, hif-3α targeting MOa, and MOb-injected embryos were raised in normoxic (Nor) or hypoxic water (Hyp). Somite number was determined at 24 hpf. Groups labeled with different letters are significantly different from each other (P < 0.05). Similar results were obtained from two independent experiments. H) Co-injection of Hif-3α targeting MO and p53 targeting MO. Zebrafish embryos were injected with a p53 targeting MO (panel b, 4 ng), hif-3α targeting MOa (panel c, 4 ng), p53 targeting MO + MOa (panel d), hif-3α targeting MOb (panel e, 2 ng), and p53 targeting MO + MOb (panel f). Panel a is the non-injected control. The embryos were raised in normoxic water and pictures were taken at 24hpf. Scale bar = 0.5 mm. |