
- Title
-
Axon degeneration and PGC-1alpha-mediated protection in a zebrafish model of alpha-synuclein toxicity
- Authors
- O'Donnell, K.C., Lulla, A., Stahl, M.C., Wheat, N.D., Bronstein, J.M., Sagasti, A.
- Source
- Full text @ Dis. Model. Mech.
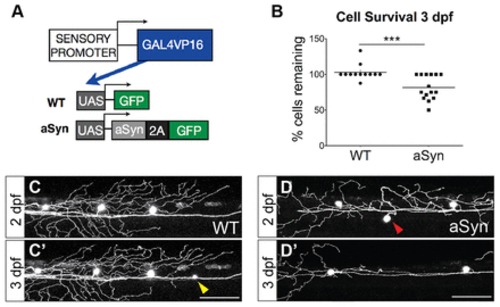
Alpha-synuclein is moderately toxic to zebrafish sensory neurons between 2 and 3 dpf. (A) Transgenes to express GFP (WT) or aSyn-2A-GFP (aSyn) were injected into wild-type embryos at the one-cell stage. The CREST3 enhancer drove expression in peripheral sensory neurons. The Gal4-UAS system was used to amplify gene expression, and a viral 2A sequence was cloned between aSyn and GFP to generate two proteins from a single transcript. (B-D) Approximately 20% of aSyn-expressing neurons died between 2 and 3 days post-fertilization (dpf) (WT 3-dpf survival: 102.9±3.2%; aSyn: 81.7±4.4%; ne12 embryos, ***P=0.0010). Some cells newly expressed GFP during the imaging period (yellow arrowhead in C). Red arrowhead in D points to a cell that died between 2 and 3 dpf. Scale bars: 100 μm. |
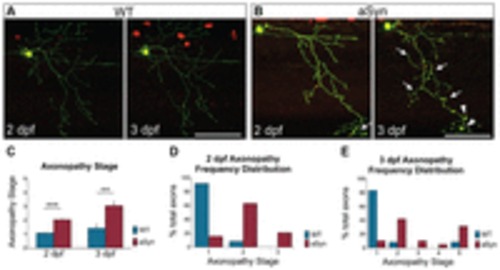
Early axonopathy in aSyn-expressing peripheral sensory neurons. Axon pathology was scored at 2 and 3 days post-fertilization (dpf) in WT and aSyn-expressing axons, using the 5-point staging system described in supplementary material Fig. S3. (A) At 2 dpf (48-58 hpf) and 3 dpf (72-82 hpf), WT axons were smooth and continuous (score of 1). (B) At 2 dpf, axonal beading (arrows) was observed in many aSyn-expressing cells. By 3 dpf, axonal dystrophy in aSyn-expressing cells was more severe, with more diffuse beading (arrows) and larger varicosities (arrowheads). (C) Quantification of average axonopathy stage in wild-type and aSyn-expressing embryos. aSyn-expressing axons were more dystrophic at both 2 dpf (WT degeneration stage: 1.03±0.08, n=12 axons in 5 animals; aSyn: 2.05±0.14; n=19 axons in 8 animals; ***P<0.0001) and 3 dpf (WT: 1.42±0.34; aSyn: 3.05±0.35; ne12 axons in e5 animals as above; **P=0.0033). (D,E) Histograms representing frequency distribution of axonopathy stage. At 2 dpf (D), 11/12 wild-type axons (91.7%) were smooth and continuous (stage 1); one exhibited mild beading (stage 2). By contrast, only 3/19 (15.8%) aSyn-expressing axons were at stage 1; 12/19 (63.2%) exhibited mild beading (stage 2), and 4/19 (21.1%) exhibited more severe axonopathy (stage 3). (E) Frequency histogram of axonopathy distribution in the same cells at 3 dpf. One wild-type axon (8.3%) exhibited mild beading (stage 2), and one wild-type cell had undergone developmental cell death (stage 5). All remaining wild-type axons (10/12, 83.3%) were smooth and continuous (stage 1). By contrast, only 2/19 (10.5%) aSyn-expressing axons remained at stage 1 by 3 dpf. 6/19 (31.6%) had fully degenerated (stage 5), and the remaining 11/19 (57.9%) were in intermediate stages of degeneration (8/19 in stage 2; 2/19 in stage 3; 1/19 in stage 4). Scale bars: 100 μm. |

Axonopathy is not followed by ‘dying back’ or Wallerian-like degeneration in aSyn-expressing neurons. (A,B) Time-lapse imaging of neurodegeneration. Cells were imaged every 20 minutes beginning 54 hours post-fertilization (hpf). Axons from at least 11 embryos from each group were transected; representative images from aSyn-expressing animals are shown. Time stamps in images are relative to the start of the imaging period. Axonal varicosities were observed (white arrowheads) several hours before cell death. White arrows point to morphological changes indicative of cell death. Inset represents cell body magnified 2×. Asterisk in A indicates separation of the axon from the cell body. Axonal fragmentation (blue arrowheads) usually did not occur before cell death, and was not stereotyped: it did not occur synchronously along the length of the axon, nor in a retrograde direction (yellow arrows point to distal portions of the axon that are still intact). (C,D) Representative images of wild-type (C) and aSyn-expressing (D) axons undergoing WD after transection with a two-photon laser. Axons were transected with a two-photon laser at 2 dpf, and embryos were imaged every 30 minutes for up to 12 hours. Red arrowhead points to site of transection. After injury, in both wild-type and aSyn-expressing axons, fragmentation was synchronous along the length of the transected axon (blue arrowheads). mpa, minutes post-axotomy. (E) There was no difference in the duration of the lag period between transection and fragmentation (WT: 129.1±10.0 minutes, n=11 axons from 11 animals; aSyn: 112.7±11.7 minutes; n=15 axons from 15 animals, P=0.3173). (F) The time between fragmentation and clearance of all axonal debris was not significantly different between the two groups (WT: 58.2±6.9 minutes; aSyn: 69.1±8.3 minutes; P=0.3213). Scale bars: 50 μm. |

WldS delays axonopathy but does not prevent cell death caused by aSyn toxicity. (A) Transgenes used to visualize the effect of aSyn and WldS expression on peripheral sensory neurons. (B) Representative images of WldS-expressing control cells at 2 (B) and 3 (B2) days post-fertilization (dpf). Axons were smooth and continuous. (C,D) Representative images of cells expressing both aSyn and WldS. At 2 dpf, aSyn+WldS-expressing axons were on average more continuous (compare with aSyn in Fig. 2). WldS did not prevent degeneration of axons in cells that died between 2 and 3 dpf (C,C2 yellow arrowhead points to degenerated soma). Axons that remained connected to cell bodies were relatively preserved (D,D2). (E) WldS did not affect survival of aSyn-expressing cells between 2 and 3 dpf (WT: 95.65±4.35%; aSyn: 79.36±6.62%; WldS+aSyn: 86.86±4.43%; n=22 animals per group; *P=0.3515). (F) Average axonopathy stage at 2 and 3 dpf. WldS-expressing aSyn axons were significantly protected at 2 dpf (aSyn: 2.05±0.14, n=19 axons from 8 animals; WldS+aSyn: 1.57±0.11; n=35 axons from 11 animals, *P=0.0114). By 3 dpf, this difference was no longer significant (aSyn: 3.05±0.35; WldS+aSyn: 2.54±0.28; P=0.2766). ***P<0.0001; **P=0.0033. (G,H) Frequency distribution of axonopathy scores at 2 (G) and 3 (H) dpf. At 3 dpf, axons that underwent cell death (aSyn: 6/19, 31.6%; aSyn+WldS: 9/35, 25.7%) had fully degenerated (axonopathy stage 5), regardless of whether or not WldS was expressed. Wild-type and aSyn axonopathy data were replotted from Fig. 2. Scale bar: 50 μm. |
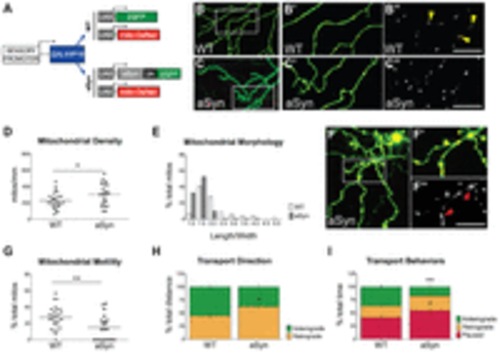
Early mitochondrial pathology and transport impairments in aSyn-expressing axons. (A) Transgenes used to visualize mitochondria in GFP-(WT) or aSyn-2A-GFP-expressing peripheral sensory neurons. Transgenes were co-injected into wild-type embryos at the one-cell stage. WT (B-B3) and aSyn-expressing (C-C3) cells were imaged at 2 dpf. Yellow arrowheads point to elongated mitochondria in wild-type axons. (D) Mitochondrial density was higher in aSyn-expressing cells (WT: 226.2±19.1 mitochondria/μm, n=26 axons in 12 animals; aSyn: 302.0±29.8 mitochondria/μm; n=20 axons in 10 animals, *P =0.031). (E) Mitochondrial morphology was quantified as the ratio of length to width in individual mitochondria. Values were binned and the frequency distribution was plotted on a histogram. Mitochondria in aSyn-expressing axons were more spherical than in wild-type axons, with fewer mitochondria exhibiting a high length:width ratio. (F) Large, swollen mitochondria occupied the spheroids in dystrophic aSyn-expressing axons. Boxed region in F is represented in F2-F3. Red arrowheads point to enlarged mitochondria. [Note that the scale bar in F3 is the same as in B3 and C3 (100 μm).] (G) Mitochondrial transport was evaluated along 50-μm axonal segments every second. Overall mitochondrial transport was significantly reduced in aSyn-expressing axons (WT % motile: 27.4±2.7%; aSyn: 15.05±3.4%; ne20 axons in e10 animals per group, as above; **P =0.0061). (H) A higher percentage of distance traveled by motile mitochondria was in the retrograde direction (WT % retrograde distance: 44.61±5.07%; aSyn: 62.17±6.06%; ne52 mitochondria; *P =0.0300). (I) Motile mitochondria spent less time moving in the anterograde direction (WT: 36.44±4.80%; aSyn: 17.39±4.05%; ne52 mitochondria; **P=0.0063), and a greater percentage of time paused than in wild-type axons (WT: 41.25±4.43%; aSyn: 54.82±4.85%; ne52 mitochondria; *P=0.0478). |
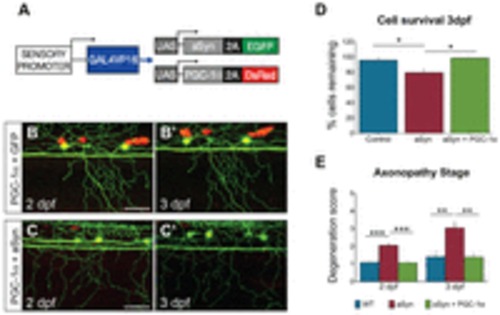
PGC-1α mitigates aSyn toxicity. (A) Transgenes co-injected to express PGC-1α and aSyn in sensory neurons. (B,C) Cells were imaged between 2 and 3 dpf. (D) PGC-1α prevented cell death in aSyn-expressing cells at 3 dpf (aSyn: 79.36±6.62%; aSyn+PGC-1α: 98.61±0.95%; ne18; *P =0.0129). (E) PGC-1α prevented axonopathy at 2 dpf (aSyn degeneration score: 2.05±0.14; aSyn+PGC-1α: 1.07±0.07; ne15; ***P<0.0001). At 3 dpf, PGC-1α-expressing axons were still protected at a level equivalent to controls (WT degeneration score: 1.42±0.34, n=12 axons in 6 animals; aSyn: 3.05±0.35, n=19 axons in 8 animals; aSyn+PGC-1α: 1.40±0.22; n=10 axons in 5 animals; one-way ANOVA with Newman-Keuls post-test, **P=0.0052). Scale bars: 50 μm. Wild-type and aSyn data were replotted from Fig. 2. |
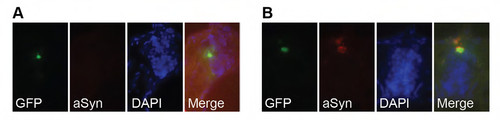
Alpha-synuclein aggregates in zebrafish peripheral sensory neurons. Embryos were injected at the 1-cell stage with transgenes indicated in Fig. 1A. At 48 hours post-fertilization, embryos were fixed in 4% PFA, sectioned, and stained with anti-alpha-synuclein primary antibody, followed by Alexa 594-conjugated goat anti-mouse IgG secondary antibody. DAPI staining was used to visualize nuclei. (A,B) Cross-sections through the spinal cord of GFP- or aSyn-2A-GFP-expressing embryos. Green fluorescence indicates Rohon-Beard cells expressing the transgene. No aSyn staining was observed in control-injected cells (A). All aSyn-injected cells exhibited red aSyn staining (B). |

Alpha-synuclein expression does not impair early survival or axonal outgrowth of peripheral sensory neurons. The CREST3:Gal4:UAS:aSyn-2A-GFP transgene was injected into embryos from a previously described stable line (Palanca et al., 2013) expressing DsRed in peripheral sensory neurons (isl1(ss):Gal4-UAS-DsRed). Embryos were imaged every hour between 32 (A) and 44 (B) hours post-fertilization (hpf). Axons grew normally during this time. (C) Cell bodies were counted, and cell survival at 44 hpf was quantified as a percentage of the earlier time point. There was no difference in survival between WT and aSynexpressing cells by 44 hpf (WT: 104.4±2.4% aSyn: 100.7±3.7%; ne13 embryos; P=0.4203). |

Axon degeneration index. (A) five-point scoring system was devised to quantify axon morphology between 2 and 3 dpf. A score of 1 was given to smooth, continuous axons. A score of 2 was given to axons with mild and diffuse or moderate but localized swellings. A score of 3 was given to axons that either had severe swelling or a small amount of fragmentation (as seen at the tips in 32). Axons with more extensive fragmentation were given a score of 4. When fragments were mostly or entirely cleared, axons received a score of 5. |