
- Title
-
Cyp26 enzymes are required to balance the cardiac and vascular lineages within the anterior lateral plate mesoderm
- Authors
- Rydeen, A.B., Waxman, J.S.
- Source
- Full text @ Development

Cyp26 expression partially overlaps with cardiovascular progenitors. (A-B2) Whole-mount double in situ hybridization of cyp26a1 and cyp26c1 expression (red) relative to nkx2.5 (blue) in wild-type embryos at 8 s. (C-D2) cyp26a1 and cyp26c1 expression relative to etv2 (blue) in wild-type embryos at 8 s. A2-D2 correspond to boxed areas in A-D, respectively. All images are dorsal views with anterior upwards. Black arrows in A2-D2 indicate cells with overlapping expression. White arrows in C2 and D2 indicate cells without overlapping expression. EXPRESSION / LABELING:
|
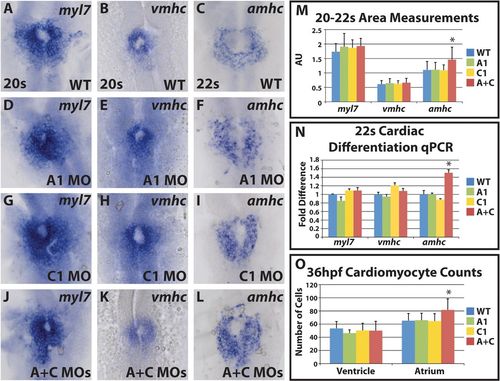
Cyp26-deficient embryos have increased atrial differentiation and cell number. (A-L) Cardiac differentiation marker expression in wild-type, cyp26a1-deficient, cyp26c1-deficient and cyp26-deficient embryos. Singular knock down of cyp26a1 (D-F) or cyp26c1 (G-I) does not affect cardiac differentiation. Double knockdown (J-L) shows an expansion of amhc expression. (M) Area measurements indicate that amhc expression is expanded in Cyp26-deficient embryos. For myl7: WT, n=38; Cyp26a1-deficient, n=12; Cyp26c1-deficient, n=18; Cyp26-deficient, n=30. For vmhc: WT, n=40; Cyp26a1-deficient, n=19; Cyp26c1-deficient, n=16; Cyp26-deficient, n=37. For amhc: WT, n=33; Cyp26a1-deficient, n=17; Cyp26c1-deficient, n=17; Cyp26-deficient, n=41. (N) RT-qPCR indicates that only amhc expression is increased in Cyp26-deficient embryos. (O) Cardiomyocyte counts reveal a specific increase in atrial cells in Cyp26-deficient embryos at 36hpf. WT, n=53; Cyp26a1-deficient, n=15; Cyp26c1-deficient, n=15; Cyp26 deficient, n=51. All images are dorsal views with anterior upwards. Significant differences compared with controls are indicated (*P<0.05). Error bars indicate s.d. EXPRESSION / LABELING:
PHENOTYPE:
|

ALPM progenitor markers are shifted anteriorly in Cyp26-deficient embryos. In situ hybridization of (A,B) nkx2.5, (C,D) hand2, (E,F) gata4, (G,H) etv2, (I,J) tal1 and (K,L) dhrs3a in wild-type and Cyp26-deficient embryos. (A-D) There is an anterior shift in nkx2.5 and hand2 expression in Cyp26-deficient embryos. Arrows in A and C indicates distances between expression and posterior eye. Arrows in B and D indicate border between expression and posterior eye, which abut in Cyp26-deficient embryos. (E-J) gata4, etv2 and tal1 expression is truncated in Cyp26-deficient embryos compared with wild-type siblings. (K,L) dhrs3a expression is expanded in Cyp26-deficient embryos. Arrows indicate length of expression. The posterior boundaries of dhrs3a expression did not overtly change in control sibling and Cyp26-deficient embryos. (M) RT-qPCR of cardiovascular progenitor genes. Cyp26-deficient embryos have decreased gata4, etv2 and tal1 expression compared with wild-type siblings. (N) Total ALPM length is the same in wild-type and Cyp26-deficient embryos. For WT: n=22 (etv2), n=10 (nkx2.5), n=21 (dhrs3a). For Cyp26-deficient: n=17 (etv2), n=12 (nkx2.5), n=20 (dhrs3a). All images are dorsal views with anterior upwards. Significant differences compared with controls are indicated (*P<0.05). Error bars indicate s.d. EXPRESSION / LABELING:
|

Loss of Cyp26 enzymes leads to differential shifts in cardiac progenitor markers. (A-B2) Double in situ hybridization of nkx2.5 (red) and etv2 (blue) shows a small gap between expression domains in Cyp26-deficient embryos that is not present in wild-type siblings. (C-D2) Double in situ hybridization with hand2 (blue) and etv2 (red) shows no space between expression domains in wild-type and Cyp26-deficient embryos. A-D are dorsal views with anterior upwards. A2-D2 are dorsal views with anterior leftwards. A2-D2 correspond to boxed areas in A-D, respectively. Arrows indicate the borders between expression domains. EXPRESSION / LABELING:
|

Inhibition of RA restores the sizes of the cardiovascular progenitor fields in Cyp26-deficient embryos. (A-D) nkx2.5 expression in wild-type, DEAB-treated, Cyp26-deficient and Cyp26-deficient+DEAB-treated embryos. (C) Cyp26-deficient embryos have an anterior shift in nkx2.5 expression, which is rescued in (D) DEAB-treated Cyp26-deficient embryos and comparable with wild-type and DEAB-treated embryos (A,B). Arrows in A-D indicate distances between posterior eye and the anterior border of nkx2.5 expression. (E-H) etv2 expression in wild-type, DEAB-treated, Cyp26-deficient and Cyp26-deficient+DEAB-treated embryos. (G) Cyp26-deficient embryos show a posterior truncation in etv2 expression, which is rescued in DEAB-treated Cyp26-deficient embryos (H). (I) Measurements of length of etv2 expression and distance from the anterior tip of the embryo to anterior border of nkx2.5 expression. For etv2 measurements: WT, n=27; DEAB-treated, n=30; Cyp26-deficient, n=17; Cyp26-deficient + DEAB-treated embryos, n=22. For nkx2.5 measurements: WT, n=27; DEAB-treated, n=26; Cyp26-deficient, n=18; Cyp26-deficient + DEAB-treated embryos, n=22. All images are dorsal views with anterior upwards. Significant differences compared with controls are indicated (*P<0.05). Error bars indicate s.d. EXPRESSION / LABELING:
|
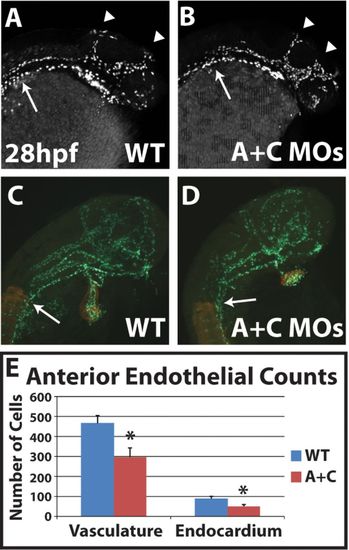
Cyp26-deficient embryos have decreased anterior endothelial cell number. (A,B) Optical sections of uninjected sibling and Cyp26-deficient Tg(kdrl:nEGFP) embryos show that Cyp26-deficient embryos have mispatterned cranial vasculature. (C,D) Representative immunostained Tg(kdrl:nEGFP) embryos for counting the cranial endothelial and endocardial cells (green). Somites and myocardial cells are indicated in red. (E) Endothelial and endocardial cell counts at 28hpf. WT, n=10; Cyp26-deficient, n=11. All images are lateral views with anterior towards the right. Arrowheads in A and B indicate primordial midbrain channel and the anterior and middle cerebral veins. Arrows in A-D indicate the somite boundary. Significant differences compared with controls are indicated (*P<0.05). Error bars indicate s.d. |

Cyp26 enzymes act non-autonomously to promote cranial endothelial specification. (A) Transplant protocol. Tg(kdrl:mCherry) embryos were injected with a blue lineage tracer. Donor cells are then transplanted into the marginal zone of host embryos and scored for endothelial contribution at 48hpf. (B,C) Representative Tg(kdrl:mCherry) donor cells that incorporated into the cranial vasculature and trunk vasculature. (D) Transplant results indicating that wild-type donor cells incorporate significantly less frequently into cranial vasculature and endocardium in Cyp26-deficient host embryos than in wild-type host embryos. Numbers in parentheses indicate the number of embryos that had contributed to the designated tissue relative to the total embryos. Images are lateral views with anterior rightwards. Significant differences compared with controls are indicated (*P<0.05). |

Cyp26a1 and cyp26c1 act redundantly in hindbrain patterning. (A-F) Flatmounted double ISH with eng2a (purple) and egr2b (red) at 8s. Singular cyp26a1 and cyp26c1 deficient and the gir mutants do not have significant changes in hindbrain patterning. (E,F) Cyp26 deficient and gir+C embryos have significant anterior shifts in the posterior rhombomeres, resulting in a loss of the rhombomeres three and four. Equivalent results were demonstrated in (Hernandez et al., 2007). All images are dorsal views with anterior left. EXPRESSION / LABELING:
|
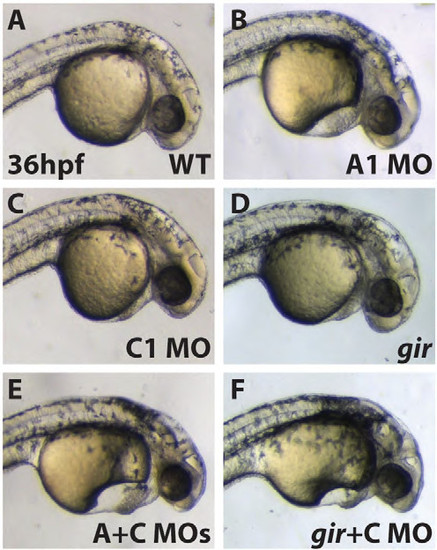
Overt phenotypes of Cyp26 deficient embryos at 36 hpf. (A) WT embryo. (B) Cyp26a1 deficient embryos have hindbrain and pericardial edema. (C) Cyp26c1 deficient embryos have no overt phenotype. (D) gir mutant has hindbrain and pericardial edema. (E) Cyp26 deficient embryos have large pericardial edema and smaller heads, essentially equivalent to (F) gir+C embryos. Images are lateral views with anterior to the right. PHENOTYPE:
|

Cyp26 deficient embryos have increased RA signaling. (A,C) Uninjected Tg(12XRARE-ef1a:EGFP)sk72 embryos at 20 hpf and 40 hpf. (B,D) Cyp26 deficient embryos have an expanded GFP expression domain at 20 hpf and 40 hpf, indicating there is increase RA signaling in these embryos. All images are lateral views with anterior right. Arrows indicate expression domain limits. Arrowhead indicates expression in the eye. |
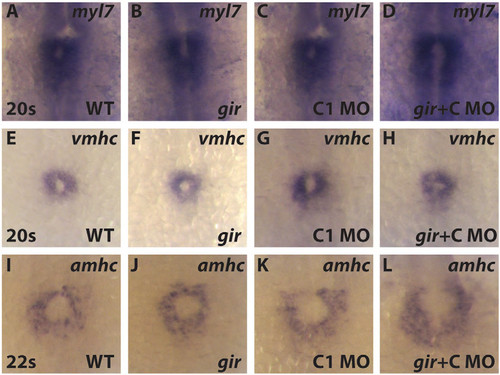
gir+C embryos have increased atrial differentiation. (A-I) Cardiac differentiation markers expression at at 20-22s. There was no difference in cardiac differentiation marker expression in gir (B,F,J) and Cyp26c1 deficient (C,G,K) embryos compared to WT siblings. (D,H,L) gir+C mutants showed increased amhc expression while myl7 and vmhc are unchanged. Embryos for this experiment were genotyped for gir as in (Emoto et al., 2005). All images are dorsal view with anterior up. |

Keto-treated embryos have increased atrial differentiation. (A-F) Cardiac differentiation marker expression in DMSO and Keto treated embryos at 20-22s. Amhc expression is expanded in Keto treated embryos, while myl7 and vmhc expression are unchanged. (G) RT-qPCR at 22s supports an increase in amhc expression without effects on myl7 and vmhc. Images are dorsal view with anterior up. |

Heart morphology is overtly unchanged in Cyp26 deficient embryos at 36 hpf. (A-F) Immunohistochemistry of 36 hpf hearts with ventricles (red) and atrium (green). There was no discernable difference in heart morphology between WT, Cyp26a1 deficient, Cyp26c1 deficient, gir mutant, Cyp26 deficient and gir+C embryos at 36 hpf. Images are lateral views with anterior upper right. |

Cardiovascular progenitor markers are shifted anteriorly in gir+C embryos. (A-P) nkx2.5, gata4, etv2, and tal1 expression in WT, gir, Cyp26c1 deficient, and gir+C deficient embryos. (A-D) Significant effects on nkx2.5 and gata4 were not observed in gir and Cyp26c1 deficient embryos. Gir+C deficient had a shift in nkx2.5 expression. (E-H) There was not a significant change in gata4 expression in any of the conditions, although gata4 was marginally truncated in gir and gir+C deficient embryos. (I-P) gir and gir+C embryos have posteriorly truncated etv2 and tal1, with gir+C deficient embryos being more affected than gir+C. Images are dorsal views with anterior up. |

Keto treatment causes cardiovascular marker phenotypes similar to Cyp26 deficient embryos. (A,B) nkx2.5, (C,D) gata4, (E,F), etv2, (G,H) tal1 expression at 8s in WT and Keto treated embryos. Similar effects on these markers were observed in Cyp26 deficient and gir+C deficient embryos. All images are dorsal views with anterior up. |

Myeloid progenitors are shifted anteriorly, but not decreased in Cyp26 deficient embryos. (A,B) ISH of spi1b in WT and Cyp26 deficient embryos. Arrows denote expression limits. Images are dorsal views with anterior up. (C) Length and area measurements of spi1b expression. |

Cyp26a1 deficient embryos have more modest truncations in endothelial progenitor markers. (A,B) nkx2.5, (C,D) gata4, (E,F), etv2, (G,H) tal1 expression at 8s in WT and Cyp26a1 deficient embryos. Etv2 and tal1 have more modest truncations compared to Cyp26 and gir+C deficient embryos. Equivalent effects on these markers were observed in gir mutant embryos (Fig. S7). All images are dorsal views with anterior up. |

Cyp26a1 deficient embryos have normal anterior endothelial cell number. (A,B) Immunostained Tg(kdrl:nEGFP) embryos. Despite a modest truncation in endothelial progenitor markers in Cyp26a1 deficient embryos, there is no difference in cranial endothelial cell number in Cyp26a1 deficient embryos compared to siblings at 28 hpf. (C) Cranial endothelial cell counts at 28 hpf. |
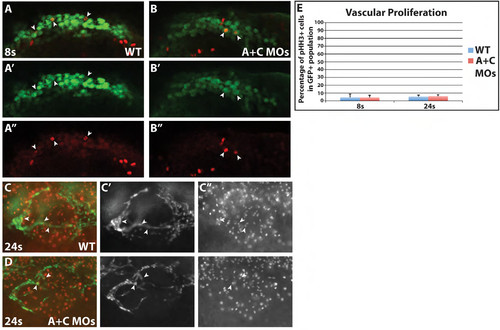
Vascular proliferation is not affected in Cyp26 deficient embryos. (A-B′′) Single optical section confocal images of WT and Cyp26 deficient TgBAC(etv2:EGFP) embryos at 8s immunostained for endothelial progenitors with GFP (green) and proliferation with pHH3 (red). Images are dorsal views of one side of the embryo with anterior to the right. (C-D′′) Single optical section apotome images of WT and Cyp26 deficient Tg(kdrl:nlsEGFP) embryos at 24 hpf immunostained for endothelial GFP (green) and pHH3 (red). Images are lateral view with anterior to the left. (E) Quantification of the percentage of proliferating vascular cells. At 8s, the WT vascular field had 4.4±4.3% proliferation compared to 4.3±2.9% in Cyp26 deficient embryos. At 24 hpf, the anterior vessels had 5.4±1.9% proliferating cells compared to 6.0±1.9% in Cyp26 deficient embryos. Arrowheads indicate proliferating VP cells. |

Cell death is not affected in Cyp26 deficient embryos. (A,B) Activated caspase-3 (casp3) staining of WT and Cyp26 deficient embryos at 8s. There were minimal apoptotic cells (arrowheads) overall in both WT and Cyp26 deficient embryos compared to proliferating cells (Fig. S12) and a not discernible increase in casp3+ cells in the ALPM of 8s stage Cyp26 deficient embryos. Images are dorsal views with anterior up. |