
- Title
-
Activation of Sonic hedgehog signaling in neural progenitor cells promotes glioma development in the zebrafish optic pathway
- Authors
- Ju, B., Chen, W., Spitsbergen, J.M., Lu, J., Vogel, P., Peters, J.L., Wang, Y.D., Orr, B.A., Wu, J., Henson, H.E., Jia, S., Parupalli, C., Taylor, M.R.
- Source
- Full text @ Oncogenesis
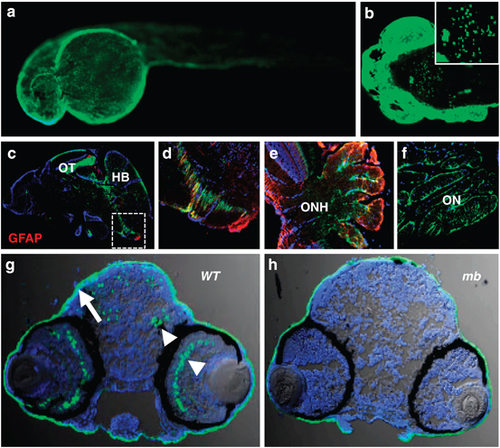
GFP expression patterns in the Tg(krt5:EGFP) line. (a) Skin epithelia expression in a 24h.p.f. embryo (side view, anterior to the left). (b) Confocal imaging of GFP-positive cells in the brain of a 72h.p.f. larva (dorsal view, anterior left). (c) Saggital cryosection of an adult fish brain showing GFP expression in the ventricular zones, the OT and the hindbrain (HB). (d) Zoomed-in view of the white frame in (c) showing GFP-positive cells in the ventricular zones resembling radial glia cells partially positive for GFAP (red). (e) GFP expression in the ONH showing little overlap with the retinal Müller glial marker GFAP (red). (f) GFP expression in the reticular astrocytes of the ON. (g) Transverse section through the brain region of a wild-type (WT) 72h.p.f. larva showing GFP expression in the skin (arrow), brain and retina (arrowheads). (h) GFP expression in the brain and the retina was absent in the mindbomb (mb) mutant background, whereas expression in the skin was not affected. All crysections were counterstained with 4′,6-diamidino-2-phenylindole (DAPI) to label nuclei (blue). |
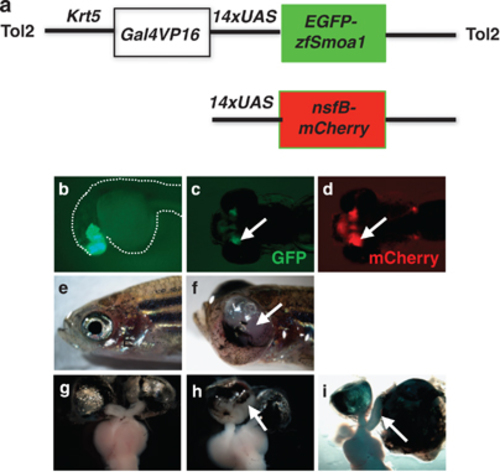
Phenotypic characterization of a stable transgenic line. (a) Graphic representation of the DNA constructs used for transgenesis and breeding. (b) A 24h.p.f. embryo expresses Smoa1-EGFP in the forebrain and retinal neuroblasts. A 96h.p.f. double transgenic embryo derived from crossing of the Tg(krt5:Gal4VP16;14 × UAS:smoa1-EGFP) and the Tg(UAS-E1b:nfsB-mCherry)c264 stable lines expressed GFP (c) and mCherry (d) in the ONs (arrows). (e) A 6-month-old wild-type and (f) a transgenic fish with a gross tumor in its left eye (arrow). (g) Wild-type fish formed a normal optic chiasm, whereas (h) transgenic fish failed to form optic chiasm and showed dramatic expansion of the ONH region (arrow). (i) Dissected brain and eyes showing an enlarged ON associating with a gross eye tumor (arrow). |
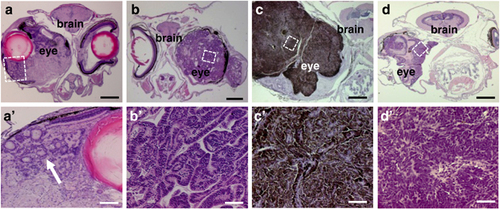
Retinal tumors resulted from expression of Smoa1-EGFP in the stable transgenic line. (a, a2) Hematoxylin and eosin (H&E) staining of transverse section of a fish with retinal dysplasia; note the formation of rosette-like structures (arrow). (b, b2) An ocular tumor resembling medulloepithelioma with characteristic neural tube structures. (c, c2) A tumor showing features of pigmented ocular melanoma with heavy pigmentation and bland nuclei. (d, d2) An adult fish developed unilateral primitive neuroectodermal tumor (PNET). White frames indicate areas that were enlarged (not to scale). Scale bars, 400μm for (a–d), 40μm for (a2–d2), respectively. |
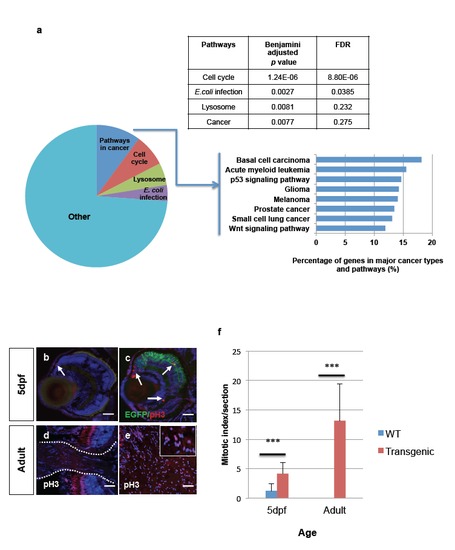
Up-regulated pathways in retinal tumors and increased mitotic index in transgenic larvae and zOPGs. (a) KEGG analysis showing significantly up-regulated pathways in retinal tumors. Benjamini adjusted p values and false discovery rates (FDR) for the top four pathways are listed. For upregulated genes involved in cancer, the major cancer subtype, cancer pathways and percentage of genes in each pathway are also shown. (b) A transverse section of a retina from a wild-type zebrafish larva at 5 dpf showing a single mitotic figure at the ciliary marginal zones (CMZ, arrow). (c) A transgenic larval retina showing mitotic figures not only at CMZ, but also in central retina (arrows). (d) A transverse section of a WT retina showing no mitotic figures at the ONH. (e) Adult retinal tumor showing mitotic figures within the sparsely nucleated zOPG area. (f) Quantification of mitotic index at both larval stage and adult stage showing significantly increased mitosis in transgenic fish when compared to WT fish (n=6 each). Scale bars, 40μm. |
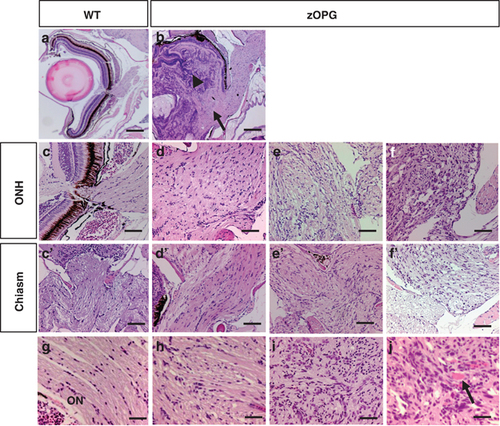
Stable transgenic fish developed zOPGs. (a) Hematoxylin and eosin (H&E) staining of paraffin sections from a wild-type (WT) adult retina, and (b) an eye tumor showing coexistence of retinal dysplasia and ON hyperplasia. Note the high cellularity originating from the neural retina (arrowhead) and low cellularity derived from ON (arrow). (c) Enlarged view of normal ONH showing low cellularity, and transgenic fish show ON hyperplasia to neoplasia (d–f). (c2) Enlarged view of a normal optic chiasm showing low cellularity, and transgenic fish showing disorganization and increased cellularity in chiasms (d2–f2). (g) High-magnification view of a normal ON showing low cellularity, with zOPGs showing increased cellularity, nuclear atypia and vascular proliferation (h–j, arrow). Scale bars, 200μm for (a and b), 40μm for (c–f2) and 20μm for (g–j), respectively. PHENOTYPE:
|
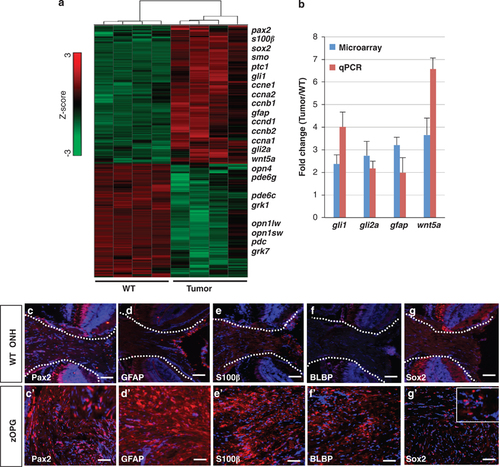
Differentially expressed genes and a radial glia cell signature of the zOPGs. (a) A heatmap generated by hierarchical clustering showing differentially expressed genes for wild-type (WT) and retinal tumors, respectively. The color scale (Z-score) is denoted on the right, with red showing upregulation and green showing downregulation. A subset of upregulated genes is listed on the right. (b) Upregulation of gli1, gli2a, gfap and wnt5a was confirmed by real-time quantitative PCR (qPCR). Microarray data represent the average expression from four eye tumors versus four control eyes. qPCR data are from the same four samples performed in quadruplicate. All data were normalized to actin b1expression. Error bars show s.d. (c–g2) Series of cryosections from a single fish with typical zOPG showed overexpression of the astrocyte/radial glia markers of Pax2 (c, c2), GFAP (d, d2), S100β (e, e2), BLBP (f, f2) and the stem cell and glioma marker Sox2 (g, g2) as compared with their respective expression in the ONH of an age-matched WT fish. Fragmented lines demarcate the ONH region. Scale bars, 40μm. |
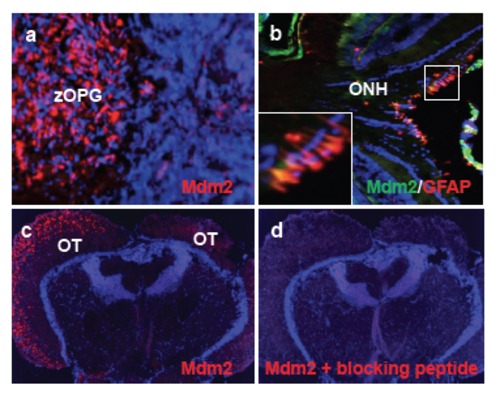
Mdm2 expression in zOPGs. (a) In a cryosection of an eye tumor, Mdm2 was overexpressed in the sparsely nucleated glioma region, but not in the densely nucleated neural retinal tumor. (b) Immunofluorescence of a wild-type fish retina showed some overlap of Mdm2 and GFAP expression in Müller glial cells in the ONH. Insert shows close-up of staining. (c) In a transverse cryosection from a fish with asymmetric optic tectum development, the enlarged tectal lobe stained positive for Mdm2, but the contralateral lobe showed little staining. (d) Specific Mdm2 staining could be blocked by the Mdm2 immunizing peptide. OT, optic tectum. |
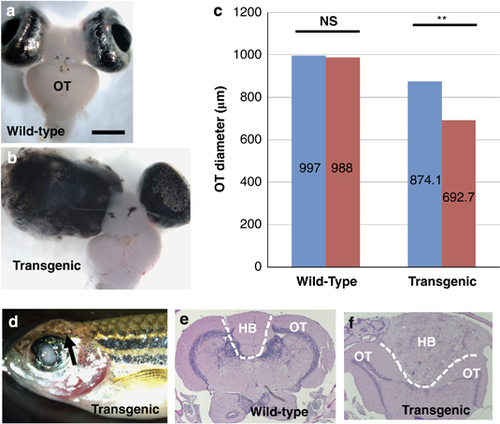
Stable transgenic fish exhibited asymmetric OT development and brain tumorigenesis. (a) A wild-type adult fish exhibited symmetric development of OT, scale bar, 1000μm. (b) A transgenic fish with gross eye tumor exhibited asymmetric OT development. (c) Comparison between left (blue bar) and right (red bar) tectal lobe diameters in the wild-type fish and between larger (blue bar) and smaller (red bar) tectal lobes in the transgenic fish showed significant difference in transgenic fish OT, but not in wild-type fish OT (n=10). NS, statistically not significant; **P<0.01. Error bars show s.d. In general, the OT from transgenic fish was smaller than wild type, because the tumor-bearing fish were smaller. (d) A 12-month-old transgenic fish showing a brain tumor (arrow); (e) hematoxylin and eosin (H&E) staining of a transverse section at the boundary of the OT and hindbrain (HB) from a wild-type fish showing symmetric OT and a small hindbrain area. (f) H&E staining of the brain tumor in (d) showing tumor formation in the HB. PHENOTYPE:
|
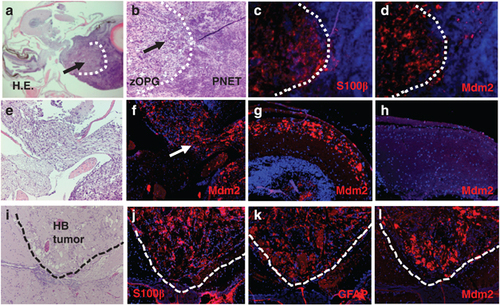
Overexpression of Mdm2 in zOPGs and hindbrain tumor. (a) Hematoxylin and eosin (H&E) staining of a transverse section from an adult fish with a less affected eye and a gross eye tumor (arrow). (b) A fragmented line demarcates the zOPG with mild cellularity and a primitive neuroectodermal tumor (PNET) with high cellularity. Immunofluorescence revealed that only the zOPG exhibited S100β (c) and Mdm2 (d) overexpression, whereas the PNET did not. (e) H&E-stained transverse section showing the optic chiasm of the same fish. Mdm2 was only expressed in the optic nerve associated with the glioma (f, arrow). (g, h) High-magnification view of the two optic tectal lobes in (a) showing Mdm2 expression in the lobe associated with zOPG (g), but not in the contralateral lobe (h). (i) H&E staining of the hindbrain tumor. The tumor overexpressed radial glia markers S100β (j), GFAP (k) and Mdm2 (l). |

Transient transgenic expression of Smoa1-EGFP resulted in CNS tumor development. (a) A six month-old fish expressing krt5-driven transgene showing a small eye (arrow). (a′) Histological analysis showed this fish had retinal dysplasia. (b) Another six-month-old krt5 fish showing a unilateral eye tumor. (b′-b′′) Histological analysis revealed a glioma-like tumor. (c) A brain tumor identified from an eight-month-old fish expressing Smoa1-EGFP driven by the nestin gene promoter, note the tumor had high level of GFP expression (c′). (d) A one-year-old fish expressing Smoa1-EGFP driven by the gfap gene promoter developed a medulloepithelioma-like eye tumor (d’-d′′). White frames indicate areas that were enlarged. |
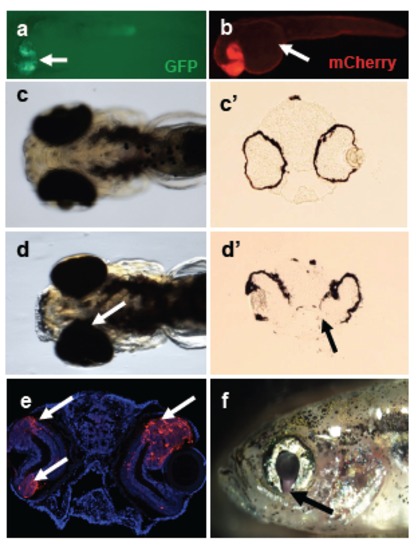
The early and late phenotypes of the Tg(krt5:Gal4VP16;14×UAS:smoa1-EGFP) stable transgenic fish. (a) Double transgenic embryo at 30 hpf derived from crossing Tg(krt5:Gal4VP16;14×UAS:smoa1-EGFP) and Tg(UAS-E1b:nfsB-mCherry)c264 lines. Note the GFP expression in the head region (arrow). (b) The same embryo showing mCherry expression not only in the head region, but also in the skin epithelia (arrow). (c) Dorsal view of a 96 hpf wild-type embryo. (c′) Transverse cryosection of the same embryo showing proper closure of the choroid fissure. (d) Transgenic embryo at 96 hpf showing a coloboma phenotype (arrow), transverse sectioning showing the choroid fissures failed to close (d′, arrow). (e) A two-week-old double transgenic juvenile showing ectopic cell proliferation at the ciliary marginal zones (arrows). (f) A 45-day old zebrafish showing failure to close the choroid fissure (arrow), a feature characteristic of coloboma. EXPRESSION / LABELING:
PHENOTYPE:
|