
- Title
-
Spectrum of Fates: a new approach to the study of the developing zebrafish retina
- Authors
- Almeida, A.D., Boije, H., Chow, R.W., He, J., Tham, J., Suzuki, S.C., Harris, W.A.
- Source
- Full text @ Development

SoFa transgenic lines. Retina sagittal sections (76 hpf). Reporter protein expression profile and corresponding diagram of each of the four transgenes used to generate the SoFa lines (A-H). (A,B) gapRFP expression of Atoh7:gapRFP retinas. Arrow indicates Atoh7+ BCs. (C,D) cytGFP expression of Ptf1a:cytGFP retinas. (E,F) Variegated gapYFP expression of Ptf1a:Gal4/UAS:gapYFP retinas. (G,H) gapCFP expression of Crx:gapCFP retinas. SoFa fish were generated combining these individual transgenic lines. (I) In Sofa1 fish, which were generated by mating Atoh7:gapRFP, Ptf1a:cytGFP and Crx:gapCFP, retinal cells are labelled with a combination of membrane-tagged and cytoplasmic FPs. (H) In Sofa2 fish, which were generated by mating Atoh7:gapRFP, Ptf1a:Gal4/ UAS:gapYFP and Crx:gapCFP, all retinal cells are labelled with a membrane-tagged FP. PR, photoreceptors; HC, horizontal cells; BC, bipolar cells; AC, amacrine cells; dAC, displaced amacrine cells; RGC, retinal ganglion cells. |

SoFa1 spatial-temporal expression highlights the retina differentiation wave. Sagittal sections of SoFa1-expressing retinas at various developmental stages. (A-E) Images showing the progression of the retinal ganglion cell (RGC), amacrine cell (AC) and photoreceptor (PR) differentiation wave from the nasal to the temporal retina. (F,G) From 72 hpf, the initial phase of retinal neurogenesis is complete and all five major cell types are easily identifiable by their colour and position in the retina. Throughout development, the retina keeps growing in size. (H) Newly differentiated multicoloured cells are generated only in the retina periphery, in the ciliary marginal zone (CMZ), as shown in the transverse section of a 2-month-old SoFa1 retina. |
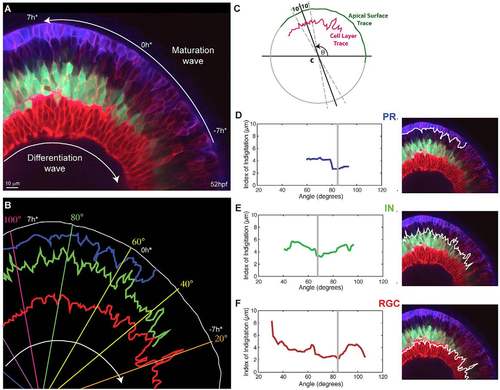
Interdigitation of emerging cell types. (A) Snapshot of a 52 hpf retina showing various degrees of interdigitation of the different cell types along the differentiation wave. The timescale, which references time in hours to the first appearance of the proto-IPL (0 h*), is based on matching the degree of lamination along the maturation wave to what we observe in our timelapse movies, where retinal lamination of a small section of the retina is followed over time (e.g. supplementary material Movie 2). (B) Traces of the apical surface (white), the basal side of the photoreceptor (PR) layer (blue), the apical side of the inhibitory neuron (IN) layer (green) and apical side of the retinal ganglion cell (RGC) layer (red) from when they first appear continuous. (C) A schematic showing how the Index of Interdigitation is calculated. (D-F) The Index of Interdigitation varies across the maturation wave for the basal side of the PR layer (D), the apical side of the IN layer (E) and the apical side of the RGC layer (F). The grey line marks the absolute minimum in each graph. |

SoFa lines allow precise identification of cell fate within developing clones. (A-I) Time lapse series of a developing SoFa1 clone in an unlabelled wild-type host. We presume this clone arose from a single progenitor cell due to its final size. Imaging started at <45 hpf, corresponding to the time of the appearance of the first gapRFP-expressing cells (Atoh7+) and image stacks were collected every hour. Some Atoh7+ cells differentiate into RGCs, whereas others divide and start expressing gapCFP (Crx+) or cytGFP (Ptf1a+). At the onset of differentiation, it is possible to identify the final fate of these cells before they reach their final position: RGCs (red cells expressing increasing levels of gapRFP, arrow), inhibitory neurons (red and green cells), PRs (purple cells). Crx+ BCs did not yet arise through the duration of the movie: <12 h time-lapse movie; extended focus confocal image, z stack=25.5 µm; step size=1.5 µm. (J,K) Examples of SoFa clones at 76 hpf, when all cell types have differentiated and show their characteristic laminar position in the retina. (J) SoFa1: PRs ( purple); BCs (blue); AC/dAC/HC (red and green); RGCs (red); single confocal image. (K) A SoFa2 clone: PRs (cyan and red); BCs (cyan); AC/dAC/HC (red and yellow); RGCs (red); 3D projection, z stack=40 µm, step size=2 µm. |
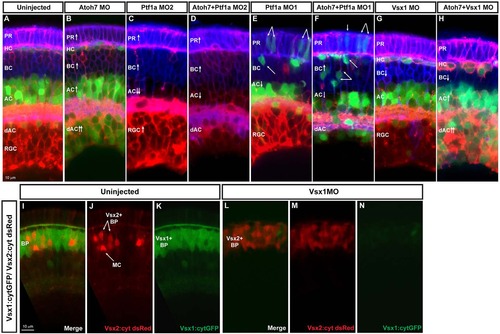
Fate switching. Images show examples of loss-of-function analysis performed using SoFa. (A) Uninjected SoFa1 retina. (B) Atoh7 morphant retina in which there is a decrease in RGCs and a clear increase in the number of dACs and ACs (red and green cells), BCs (blue cells) and PRs (purple cells). (C,E) Ptf1a MO1 and MO2 morphant retinas. Ptf1a MO2 (C) is a more potent translation-blocking morpholino that interferes with both Ptf1a and Ptf1a: cytGFP expression. Ptf1a MO1 (E) is a splice-blocking morpholino, which consequently knocks down the translation of Ptf1a, but not ptf1a:cytGFP, so cells that would have been ACs and HCs can be seen in their transfated states. In these morphants, we see reductions in the generation of ACs, dACs and HCs, and an increase in the number of RGCs (red), BCs (blue) and PRs (purple). (D,F) Atoh7/Ptf1a double morphants, showing a retina devoid of RGCs and HCs, with a significant reduction in the number of dAC and ACs (red only), a significant increase in the number of PRs (purple) and BCs (blue), and an increased amount of transfating. (G,H) Knockdown of Vsx1 alone leads to a small decrease in BCs because of compensation from Vsx2, whereas simultaneous knockdown of Vsx1 and Atoh7 leads to increases in ACs [especially displaced ACs (red and green) and PRs (purple)]. (I-K) Cross sections of uninjected Vsx1:cytGFP; Vsx2:cyt dsRed retinas. Most BCs are green, indicating that they are Vsx1+. (L-N) Knockdown of Vsx1 results in loss of most Vsx1+ BCs, but there is almost a complete compensation in BC numbers via an increase in Vsx2+ BCs. |
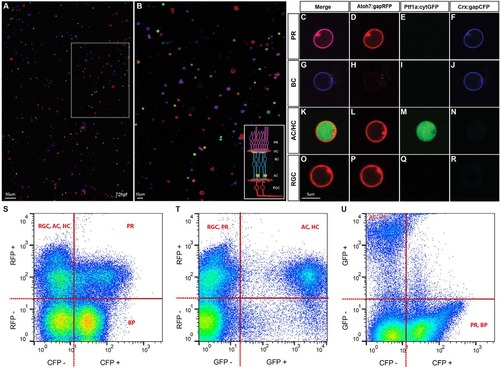
Cell type identification in dissociated retinal cultures. (A,B) SoFa1-dissociated retinal cells and correspondent high magnification inset, showing that all cell types can be easily identified by their specific combination of colours. (C-R) Representative images of cells of each cell type (red, green and blue channels shown separately and merged). PRs are labelled in purple, as they express both Atoh7 and Crx (C); BCs are labelled in blue, as most of them express exclusively Crx (G); AC and HC are labelled in red and green, as they express both Atoh7 and Ptf1a (K); and RGCs are labelled in red, as all express Atoh7 (O). (S-U) Flow cytometry profiles of dissociated SoFa1 retinas, showing that it is possible to sort the different retinal populations. (S) RFP and CFP profile; (T) RFP and GFP profile; and (U) GFP and CFP profile. |

Dynamics of the retina differentiation wave Time lapse series of a developing SoFa1 retina, showing the RGC, AC and PR differentiation waves (A-L). The figure demonstrates that although some cell types tend to differentiate before others, there is a substantial overlap in the generation of the different fates. |

SoFa2 Plexiform Layers High magnification views of the outer (OPL) and inner (INL) plexiform layers of SoFa2 retinas, showing that by labeling all retinal neurons with a membrane tagged FP it is possible to study the process of lamination of the plexiform layers (compare E with K) and potentially connectivity in the retina. (A-D) 76hpf OPL. (E-H) 76hpf INL. (I-L) 120hpf INL. |