
- Title
-
MicroRNA-92a upholds Bmp signaling by targeting noggin3 during pharyngeal cartilage formation
- Authors
- Ning, G., Liu, X., Dai, M., Meng, A., and Wang, Q.
- Source
- Full text @ Dev. Cell
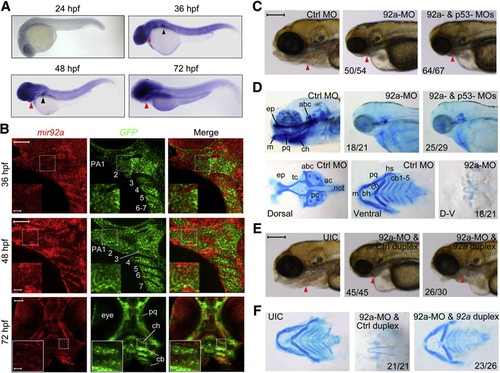
mir92a Expression Pattern and Knockdown Effect on Head Cartilages in Zebrafish Embryos (A) Expression pattern of mir92a at different stages as detected by in situ hybridization. The pharyngeal region and pectoral fins were indicated by a red and a black arrowhead, respectively. (B) Expression of mir92a in pharyngeal arches. Tg(fli1:EGFP) transgenic embryos at 36–72 hpf were hybridized with mir92a (red) and GFP (green) probes, and the signals were amplified with TSA tetramethylrhodamine. Seven pharyngeal arches (PA1–7), with dorsal to the right, were labeled in the middle picture. cb, ceratobranchial; ch, ceratohyal; pq, palatoquadrate. The boxed areas in the images were presented at higher magnification in the relevant insets. Scale bars, 50 or 10 µm in the inset. (C) Morphology of the head in morphants at 96 hpf. The pharyngeal region was indicated by an arrowhead. Lateral views. Each MO was injected into one-cell stage embryos at the dose of 4 ng. The ratio of embryos with representative pharyngeal cartilage defects (shown) was indicated. Scale bar, 200 µm. (D) Head cartilages stained with Alcian blue at 80 hpf. Upper panel, lateral views; lower panel, dorsal or ventral views. Lower panel showed the pattern of dorsal neurocranium (left picture) and ventral pharyngeal cartilages (middle picture) with labels: ep, ethmoid plate; tc, trabeculae cranii; pc, parachordal; ac, auditory capsule; abc, anterior basicranial commissure; bh, basihyal; cb, ceratobranchial; ch, ceratohyal; hs, hyosymplectic; m, Meckel’s cartilage; not, notochord; pq, palatoquadrate. The skeletons were positioned with anterior to the left (the same applied to the other figures below). (E and F) mir92a-MO-induced pharyngeal cartilage defects were rescued by coinjection of mir92a duplex. We injected 4 ng of 92a-MO plus 1 nl of control miRNA duplex or mir92a duplex at a concentration of 25 µM at the one-cell stage. Head morphology at 96 hpf (E) or Alcian blue-stained head cartilages at 80 hpf (F) were shown. UIC, uninjected control embryos; also applied to the other figures. Scale bar in (E), 200µm. See also Fig. S1. EXPRESSION / LABELING:
PHENOTYPE:
|
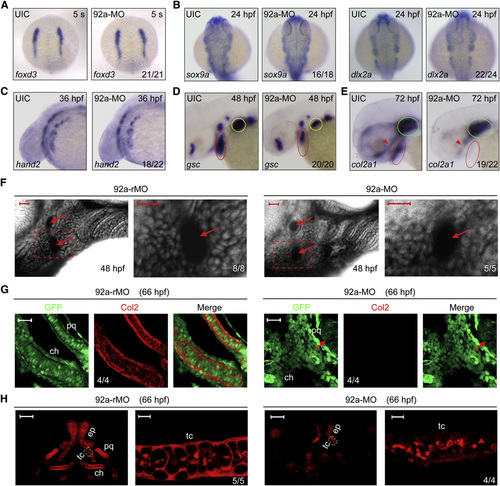
Inactivation of mir92a Affects Late but Not Early Steps of Pharyngeal Cartilage Development (A–E) The expression pattern of various markers in uninjected (UIC) or 92a-MO-injected (4 ng) embryos as detected by whole-mount in situ hybridization. Embryos in (A) and (B) were dorsal views with anterior to the top; the other embryos were lateral views with anterior to the left. The indicated ratio was the number of embryos with the shown representative phenotype/total number of observed embryos. Red and yellow circles in (D) indicated the pharyngeal region and pectoral fin, respectively. In (E), red and green circles indicated the pharyngeal arches and the cartilage capsule of the ears, and red arrowhead indicated the ethmoid plate and trabeculae cranii of dorsal neurocranial cartilages. (F) The prechondrogenic condensation in mir92a morphants appeared normal. Embryos were injected at the one-cell stage with 4 ng 92a-rMO or 92a-MO, treated with BODIPY-ceramide at the end of gastrulation, and imaged by confocal microscopy at 48 hpf. The pharyngeal region was laterally viewed with dorsal to the top and anterior to the left. Extracellular space and cavity looked black. Arrows indicated aortic arches. The boxed area in the left image was enlarged and presented in the right. Scale bars, 20 µm. (G) Detection of Col2 protein in pharyngeal prechondrogenic progenitors. Tg(fli1:EGFP) transgenic embryos were injected with 4 ng 92a-rMO or 92a-MO at the one-cell stage and coimmunostained with anti-GFP and anti-Col2 antibodies. The palatoquadrate (pq) and ceratohyal (ch) precartilages were shown with anterior to the top. Arrows in the right panel indicated eyes. Scale bars, 20 µm. (H) Detection of Col2 in the neurocranial cartilages. Wild-type embryos, injected as in (G), were immunostained with anti-Col2 antibody. For each panel, the left was the dorsal view of the head region with anterior to the top and the right represented an enlargement of the area boxed in the left. Dorsal view, anterior to the top. The boxed area in the left image was presented at higher magnification in the corresponding right image. ch, ceratohyal; ep, ethmoid plate; pq, palatoquadrate; tc, trabeculate cranii. Scale bars, 50µm (left) and 5µm (right). See also Fig. S2. EXPRESSION / LABELING:
PHENOTYPE:
|
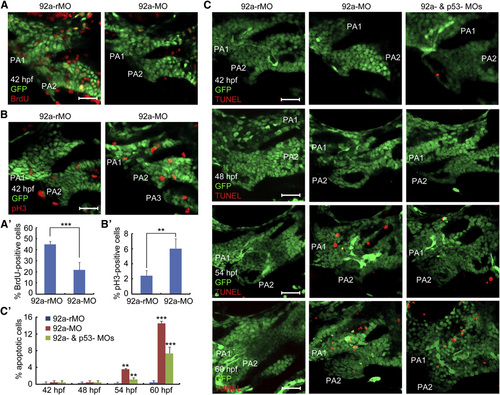
Inhibition of mir92a Activity Impairs Proliferation and Survival of Chondrogenic Progenitors (A–B2) Representative confocal sections showing BrdU- or pH3-positive cells (red) in the pharyngeal region. 92a-rMO or 92a-MO-injected (4 ng) Tg(fli1:EGFP) transgenic embryos were coimmunostained with anti-GFP and anti-BrdU (A) or anti-pH3 antibodies at 42 hpf (B). The images shown were lateral views for the first two pharyngeal arches (PA1 and PA2) (similarly labeled in C). Scale bars, 20 µm. The percentage of BrdU- or pH3-positive cells among GFP-positive pharyngeal chondrogenic progenitors, based on five embryos (one to two images each) for each group, were shown in (A2) and (B2). p < 0.01; p < 0.001. (C and C2) Detection of apoptotic cells in the pharyngeal regions. Tg(fli1:EGFP) transgenic embryos were injected with 92a-rMO, 92a-MO, or 92a-MO plus p53-MO (at 4 ng each) and collected at indicated stages for TUNEL assay. Representative images were shown in (C). The ratio of TUNEL- and GFP-positive cells (orange) to GFP-positive cells in the first and second pharyngeal arches were calculated from five embryos with one to two images each and presented in (C). Scale bars, 20µm. See also Fig. S3. |
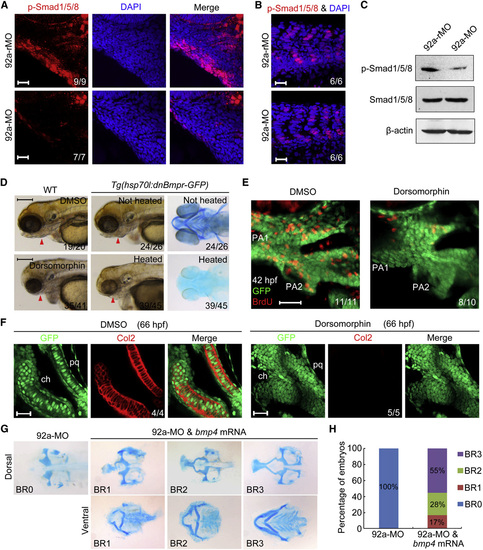
mir92a Regulates Bmp Signaling during Pharyngeal Cartilage Formation (A–C) p-Smad1/5/8 levels were reduced in the pharyngeal region of mir92a morphants. 92a-rMO and 92a-MO-injected (4 ng) Tg(fli1:EGFP) embryos at 42 hpf were stained for p-Smad1/5/8 using anti-p-smad1/5/8 and DAPI (A, B). The pharyngeal region (A) and trunk somite muscle (B) were observed after immunostaining by confocal microscopy. p-Smad1/5/8 in cell lysis of head region at 42 hpf was detected by western blotting (C). Scale bars, 20 µm. (D) Embryos depleted of Bmp activity showed severe pharyngeal cartilage defects. Dorsomorphin-treated wild-type (WT) or heat-shocked Tg(hsp70l:dnBmpr-GFP) transgenic live embryos were photographed at 96 hpf and Pharyngeal cartilages of heat-shocked transgenic embryos at 80 hpf were detected with Alcian blue. Scale bars, 200 µm. (E) Embryos depleted of Bmp activity showed a reduced proliferation of pharyngeal chondrogenic progenitors. BrdU-treated Tg(fli1:EGFP) transgenic embryos were stained at 42 hpf with anti-BrdU (red) and anti-GFP antibodies (green). The pharyngeal regions were observed by confocal microscopy. Scale bar, 20 µm. (F) Deficiency of pharyngeal chondrogenic progenitor differentiation in dorsomorphin-treated embryos. Confocal sections of the palatoquadrate (pq) and ceratohyal (ch) cartilages of Tg(fli1:EGFP) transgenic embryos. These embryos were treated with DMSO or 10 µM dorsomorphin at 36 hpf and probed with anti-GFP and anti-Col2 antibodies at 66 hpf. Scale bars, 20 µm. (G and H) 92a-MO-induced pharyngeal cartilage defects were rescued by bmp4 overexpression. Wild-type embryos were injected with 4 ng 92a-MO alone or together with 7 pg bmp4 mRNA at the one-cell stage and stained with Alcian blue for cartilages at 80 hpf. Coinjected embryos showed different levels of recovery of neurocranium and pharyngeal cartilages. Representative cartilage phenotypes (BR0-BR3) were shown in (G) and their ratios were shown in (H). See also Fig. S4. |
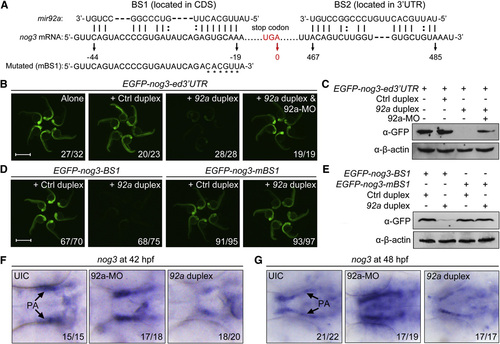
mir92a Directly Targets nog3 mRNA In Vitro and In Vivo (A) The two putative binding sites of mir92a in nog3 mRNA. The position of the last base of the stop codon was numbered 0. (B and C) The expression of the reporter GFP-nog3-ed32UTR was inhibited by mir92a duplex. We injected 100 pg of the reporter mRNA at the one-cell stage alone or together with 1 nl of control miRNA duplex (Ctrl duplex), mir92a duplex, or mir92a duplex (20 µM) plus 4 ng 92a-MO, and injected embryos were observed for GFP fluorescence at 24 hpf (B). The GFP protein levels at 24 hpf were also examined by western blot with the anti-GFP antibody (C). Scale bar, 1 mm. (D and E) The expression of EGFP-nog3-BS1 but not EGFP-nog3-mBS1 reporter was inhibited by injection of mir92a duplex. The embryos were similarly injected and observed (D) as in (B). Scale bar, 1 mm. The GFP expression levels at 24 hpf were also examined by western blot with the anti-GFP antibody (E). (F and G) Alteration of nog3 mRNA levels in embryos injected with 4 ng 92a-MO or 10 µM 92a duplex (1 nl per embryo). Uninjected (UIC) or injected embryos at 42 (F) and 48 hpf (G) were probed using the nog3 antisense probe. Ventral views with anterior to the left. The ratio of embryos with altered expression to the total was indicated. See also Fig. S5. |
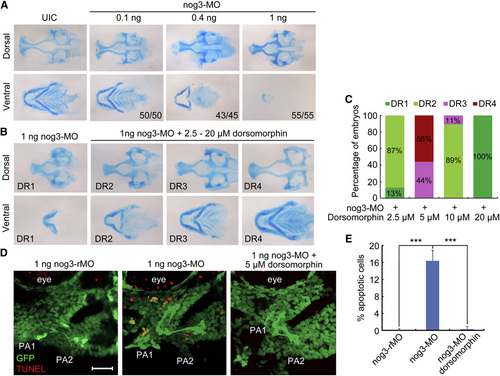
Knockdown of nog3 Derepresses Bmp Signaling and Induces Chondrogenic Progenitor Apoptosis (A) Pharyngeal cartilage defects in nog3 morphants. Wild-type embryos were injected at the one-cell stage with different doses of nog3-MO and stained for cartilages with Alcian blue. (B and C) nog3-MO-induced cartilage defects were alleviated by inhibition of Bmp activity with dorsomorphin. nog3-MO-injected (1 ng) embryos at 36 hpf were treated in DMSO or dorsomorphin of different concentrations and stained for cartilages at 80 hpf with Alcian blue. The extents of cartilage defects were categorized into four groups, DR1–4 (B), and the ratio of each group was shown in (C). (D and E) Detection of apoptotic cells in nog3 morphants. Tg(fli1:EGFP) transgenic embryos were injected at the one-cell stage with 1 ng nog3-rMO or nog3-MO and subjected to TUNEL assay (red) at 42 hpf. For dorsomorphin treatment, injected embryos at 36 hpf were incubated with 5 µM dorsomorphin until 42 hpf. The images shown were lateral views of the first two pharyngeal arches (PA1 and PA2) (D). Scale bar, 20µm. The percentage of TUNEL-positive cells among the total number of pharyngeal chondrogenic progenitors (GFP-positive) in the imaged region was calculated based on five embryos each group (E). p < 0.001; error bars indicated SD. See also Fig. S6. EXPRESSION / LABELING:
PHENOTYPE:
|
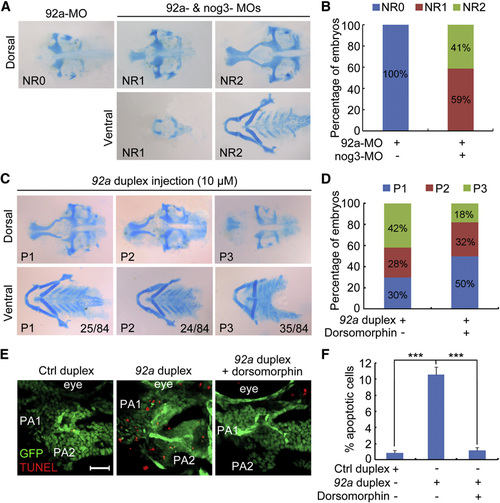
Genetic Interactions among mir92a, nog3, and Bmp Activity during Pharyngeal Cartilage Development (A and B) 92a-MO-induced pharyngeal cartilage defects were rescued by coinjection of nog3-MO. Embryos injected with 4 ng 92a-MO alone or together with 0.1 ng nog3-MO at the one-cell stage, and harvested for Alcian blue staining at 80 hpf. Different degrees of rescue effects (NR0–NR2) were observed (A), and the ratio of each group was shown in (B). (C) Ectopic expression of mir92a resulted in pharyngeal cartilage defects. Wild-type embryos were injected with 10 µM mir92a duplex at the one-cell stage, and stained at 80 hpf for cartilages with Alcian blue. Pharyngeal cartilage defects were categorized into groups P1–P3 (C), and the ratio of each group was indicated in the corresponding picture. (D) mir92a duplex-induced pharyngeal cartilage defects were compromised by dorsomorphin treatment. Embryos injected with 10 µM mir92a duplex were treated in 5 µM dorsomorphin at 36 hpf and stained at 80 hpf for cartilage with Alcian blue. The percentage of embryos with different degrees of cartilage defects was calculated. (E and F) mir92a duplex-induced apoptosis in the pharyngeal region. Tg(fli1:EGFP) transgenic embryos injected with 1 nl of 10 µM mir92a duplex were treated in 5 µM dorsomorphin at 36 hpf, subjected to TUNEL assay at 42 hpf, and observed by confocal microscopy. The representative images were lateral views of the first two pharyngeal arches (PA1 and PA2) (E). Scale bar, 20µm. The ratio of TUNEL- and GFP-positive cells (orange) to GFP-positive cells in the first and second pharyngeal arches were calculated from five embryos with one to two images each and presented in (F). See also Fig. S7. PHENOTYPE:
|
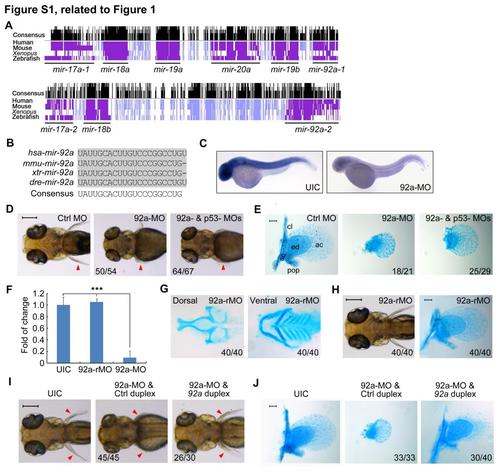
mir92a sequence conservation and its knockdown effect on cartilage development of pectoral fins, related to Figure 1. (A) Conservation plots of mir-17-92 (top) and mir-106a-92 (bottom) paralogous clusters in vertebrates. (B) Sequence alignment of mature mir92a from different species. (C) Embryos were injected with 4 ng of 92a-MO at the one-cell stage and collected at 36 hpf for whole-mount in situ hybridization using LNA antisense mir92a probe. UIC, uninjected control. (D) Ventral views showing live embryos at 96 hpf. Embryos were injected with 4 ng 92a-MO alone or together with 4 ng p53-MO at the one-cell stage. The pectoral fins were indicated by arrowheads. Scale bar, 200 µm. (E) Staining of fin skeletons with Alcian blue at 80 hpf. The right-side pectoral fin skeleton was shown with anterior to the top. Embryos were injected as in (D). Note the absence of cleithrum (cl) and scapulocoracoid (sc) cartilages and postcoracoid process (pop) of pectoral fins as well as smaller endoskeletal disc cartilage (ed) in mir92a morphants. Scale bar, 100 µm. (F) 92a-MO injection effectively blocked amplification of mir92a expression in embryos at 42 hpf. Embryos were injected with 4 ng of the corresponding morpholino and collected at 42 hpf for detection of mir92a by semi-quantitative stem-loop RT-PCR. ***, p < 0.001 (by Student’s t-test); error bars indicated SD. (G-H) The head cartilage formation and pectoral fin development were unaffected by 92a-rMO injection. Head cartilages (G) and fin skeletons (H) were stained with Alcian blue at 80 hpf. The live injected embryo at 96 hpf (H, right panel) also showed a pair of normal fins. All images were dorsal views with anterior to the left. Scale bars, 200 µm for the left panel and 100 µm for the right panel. (I-J) Co-injection with 1 nl of 25 µM mir92a duplex rescued 92a-MO-induced loss of pectoral fins. Live embryos at 96 hpf were shown in (I) with the pectoral fins indicated by arrowheads. Fin cartilages stained with Alcian blue at 80 hpf were shown in (J). The ratio of affected embryos to the total number of embryos was indicated. All were dorsally viewed. Scale bars, 200 µm (I) or 100 µm (J). PHENOTYPE:
|

mir92a inactivation impairs pharyngeal cartilage formation independent of blood flow, related to Figure 2. (A) Detection of cell surface proteins in the pharyngeal mesenchymal condensations by Peanut Agglutinin (PNA) staining. Embryos were injected with 4 ng 92a-rMO and 92a-MO, and collected for PNA staining at 60 hpf. The anterior first two pharyngeal arches (PA) were shown. The boxed area in the left image was presented at higher magnification in the corresponding right image. Scale bars, 20 µm (left) or 10 µm (right). (B) F-actin-labeled morphological changes in mir92a morphants at different stages. Wild-type embryos were injected with 4 ng 92a-rMO or 92a-MO at the one-cell stage and fixed at indicated stages for Phalloidin staining. Stained embryos were imaged by confocal microscopy with focus on the pharyngeal arch region. The order of the pharyngeal arches (PA) in the focus plane was indicated. For each panel, the boxed area in the left image was presented at higher magnification in the corresponding right image. At least 5 embryos were analyzed each group. Scale bars, 20 µm for the left image of each panel and 5 µm for the right image of each panel. (C-F) Confocal images of blood vessels (green) and blood cells (red) in the branchial (C, E, F) and trunk (D) regions. Tg(flk1:EGFP);Tg(gata1:DsRed) double transgenic embryos were injected with 4 ng 92a-rMO or 92a-MO at the one-cell stage and observed by confocal microscopy at 36 hpf, 42 hpf and 48 hpf. Scale bars, 50 µm. (G) Head skeleton of cloche mutant embryos. The embryos collected from clo m378 heterozygote intercrosses were injected with 4 ng 92a-rMO or 92a-MO at the one-cell stage. clo mutants were sorted out at about 48 hpf based on the absence of blood cells and stained with Alcian blue at 80 hpf. The images were orientated with anterior to the left. EXPRESSION / LABELING:
PHENOTYPE:
|
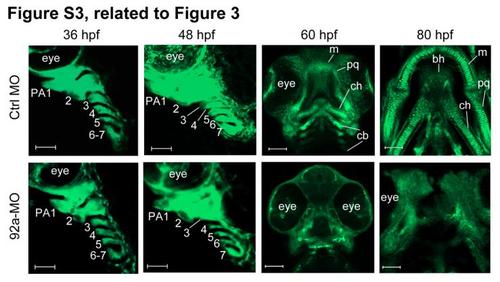
Time-lapse imaging of the pharyngeal region of Tg(fli1:EGFP) transgenic embryos, related to Figure 3. The embryos were injected with 4 ng Ctrl-MO or 92a-MO at the one-cell stage and observed by confocal microscopy at later stages. The pharyngeal arches were numbered. bh, basihyal; cb, ceratobranchial; ch, ceratohyal; m, Meckel’s cartilage; pq, palatoquadrate. Scale bars, 50 µm for 36, 48 and 60 hpf, and 100 µm for 80 hpf. EXPRESSION / LABELING:
PHENOTYPE:
|

Inhibition of Bmp activity prevents pectoral fin development but does not promote cell apoptosis at earlier stages of pharyngeal cartilage development, related to Figure 4. (A) Effect of inhibition of Bmp signaling on pectoral fin development. Wild-type (WT) embryos treated with 10 M of the Bmp inhibitor dorsomorphin or Tg(hsp70l:dnBmpr-GFP) transgenic embryos heat-shocked for the expression of the dominant negative Bmp receptor showed shorter and smaller pectoral fins (indicated by arrowheads) at 80 hpf. The embryos were dorsally viewed with anterior to the left. The third column showed pectoral fin cartilages stained with Alcian blue. Heat-shocked Tg(hsp70l:dnBmpr-GFP) transgenic embryos exhibited a reduction of endoskeletal disc and cleithrum cartilages with missing of the scapulocoracoid cartilage (indicated by arrowheads). Scale bars, 200 µm for the first two columns and 100 µm for right column. (B) Effect of inhibition of Bmp signaling on cell apoptosis. Tg(fli1:GFP) transgenic embryos treated with 10 M of the Bmp inhibitor dorsomorphin were subjected to TUNEL assay at 42 hpf. Representative confocal microscopic images of TUNEL-positive (red) chondrogenic progenitors (green) in the first and second pharyngeal arches (PA) were shown. Scale bar, 20 µm. EXPRESSION / LABELING:
PHENOTYPE:
|
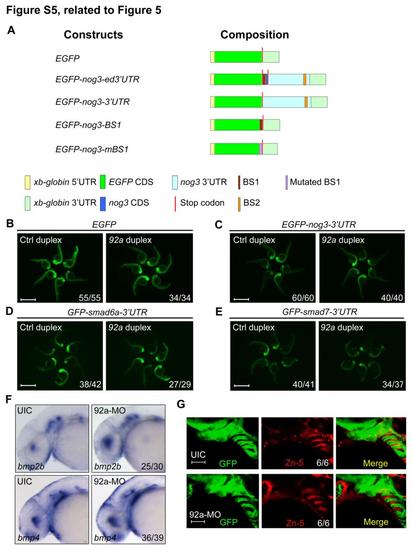
Test of mir92a targets, related to Figure 5. (A) Schematic diagrams of reporter constructs. (B) The expression of the reporter GFP mRNA was unaffected by mir92a duplex. 60 pg of GFP mRNA was injected together with 1 nl of 20 M Ctrl duplex or mir92a duplex at the one-cell stage, and the injected embryos were observed for GFP fluorescence at 24 hpf. Scale bars, 1 mm. (C-E) mir92a had no effect on the expression of GFP-nog3-3′UTR (C), GFP-smad6a-3′UTR (D) and GFP-smad7-3′UTR (E) mRNAs. 60 pg of each mRNA species were co-injected with 1 nl of 20 M Ctrl duplex or mir92a duplex at the one-cell stage. The injected embryos were observed at 24 hpf. Scale bars, 1 mm. (F) bmp2b and bmp4 expression was detected by whole-mount in situ hybridization in uninjected control embryos (UIC) or mir92a morphants at 42 hpf. (G) Tg(fli1:GFP) transgenic embryos at 42 hpf were immunostained with anti-GFP and anti-Zn-5 antibodies. Scale bars, 50 µm. EXPRESSION / LABELING:
|
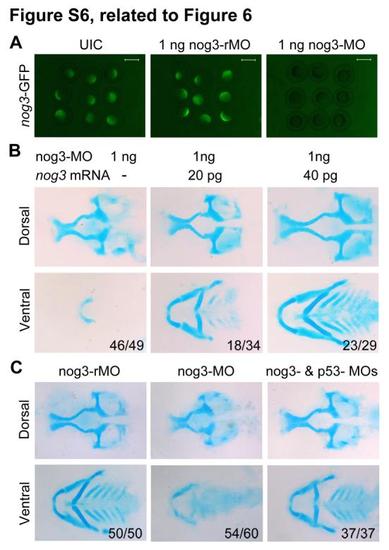
nog3-MO-induced head skeletal defects could be rescued by co-injection of p53-MO, related to Figure 6. (A) Effectiveness of nog3-MO. Embryos injected with 50 pg nog3-GFP plasmid DNA showed green fluorescence at the shield stage. Green fluorescence was obviously decreased when co-injected with 1 ng nog3-MO. (B) co-injection of nog3 mRNA rescued nog3-MO-induced pharyngeal cartilage defects. Embryos at the one-cell stage were injected with 1 ng of nog3-MO alone or plus an indicated amount of nog3 mRNA and harvested at 80 hpf for staining head cartilages with Alcian blue. nog3 mRNA carried several mutated bases around the translation start site, which did not change the identities of the encoded amino acids, so that nog-MO would not bind to it. (C) The head cartilage defects in nog3 morphants could be rescued by co-injection of 4 ng p53-MO. Head cartilages stained with Alcian blue at 80 hpf. Upper panel, lateral views; lower panel, dorsal views. |
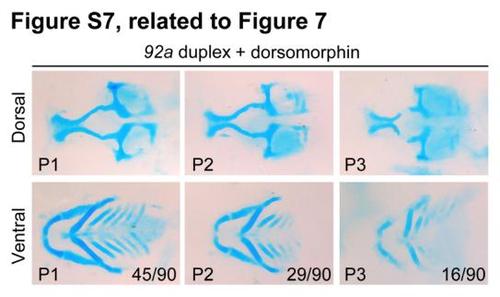
mir92a duplex-induced pharyngeal cartilage defects could be partially rescued by dorsomorphin treatment, related to Figure 7. Embryos injected with 10 µM mir92a duplex were treated in 5 µM dorsomorphin at 36 hpf and stained at 80 hpf for head cartilages with Alcian blue. Pharyngeal cartilage defects were categorized into groups P1 - P3 and the ratio of each group was indicated in the corresponding picture. |
Reprinted from Developmental Cell, 24(3), Ning, G., Liu, X., Dai, M., Meng, A., and Wang, Q., MicroRNA-92a upholds Bmp signaling by targeting noggin3 during pharyngeal cartilage formation, 283-295, Copyright (2013) with permission from Elsevier. Full text @ Dev. Cell