
- Title
-
Kappe neurons, a novel population of olfactory sensory neurons
- Authors
- Ahuja, G., Nia, S.B., Zapilko, V., Shiriagin, V., Kowatschew, D., and Oka, Y., and Korsching, S.I.
- Source
- Full text @ Sci. Rep.
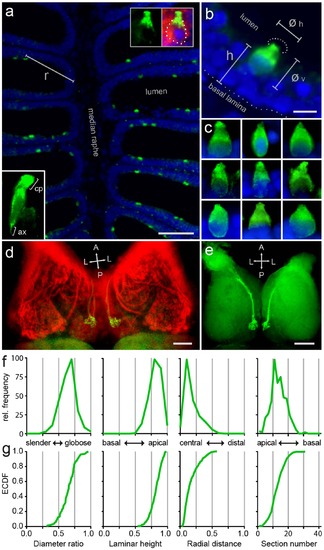
(a) Go-ir (green) is seen in a sparse population of pear-shaped cells in horizontal sections of the olfactory epithelium (short-fixed), using DAPI as counter-stain (blue); r, radial distance. Top right inset at higher magnification shows a Go-ir-positive cell (green), co-labeled with zns2 (red), and visible nucleus (DAPI, blue). Bottom left inset at higher magnification shows a Go-ir-positive cell with initial axon segment (ax) and cap (cp). (b) At higher magnification the apical position of Go-ir-positive cells (green) is clearly visible. øv, vertical cell diameter; øh, horizontal cell diameter; h, laminar height; dotted half-circle, the apical dendritic part of Go-ir-positive olfactory sensory neurons resembles a cap. (c) Nine Go-ir-positive cells show the typical range of morphologies for these neurons. (d) Whole mount of adult zebrafish olfactory bulb double-labeled with anti- Go and anti-zns2 antibodies, dorsal view. Zns2 labels all glomeruli, whereas Go-ir labels a single medial glomerulus (yellow).The olfactory nerves were cut at the entrance to the olfactory bulb before staining. (e) Horizontal vibrotome cross-section (100µm) reveals the extremely dorsal position of the Go-immunoreactive glomerulus in each olfactory bulb. A single, thick axon bundle is seen entering the glomerulus. (f,g) One shape parameter and three spatial parameters were quantified for the Go-ir-positive cell population, and shown as histogram (f) and empirical cumulative distribution function, ECDF (g). From left to right: ratio of horizontal to vertical diameter, laminar height (normalized to maximal height), radial distance (normalized to maximal radius), and number of cells per 10µm horizontal cross section of the olfactory epithelium; x axis units and labels are valid for both (f) and (g). Scale bars correspond to 50µm (a), 5µm (b), and 100µm (d, e). EXPRESSION / LABELING:
|

Go-ir-positive neuron population is different from crypt neurons. (a) Double labeling with anti-Go antibody (green) and anti-S100 antibody (red, marker for crypt neurons) in cryostat sections of short-fixed olfactory epithelium reveals two mutually exclusive sensory neuron populations. Insets, single neurons at higher magnifications. Note the differences in morphology of these two cell populations; arrow in top right insert, the cap-like structure typical for Go-ir-positive neurons. (b–c) Higher magnifications show the typical shapes of Go-ir-positive neurons (pear-shaped) and crypt neurons (globose), indicated by filled arrow heads and open arrow heads, respectively. (d–e, g–h) One shape parameter and three spatial parameters (see Fig. 1b for graphical explanation) were quantified for the TrkA-ir-positive cell population and the corresponding empirical cumulative distribution function, ECDF, was compared with that of Go-ir-positive neurons; ***, distributions of TrkA-ir and Go-ir cells are significantly different (p < 106), as assessed by Kolmogorov-Smirnov test of the unbinned distributions. (d), ratio of horizontal to vertical diameter [diameter ratio (øh/øv)], (e), laminar height normalized to maximal height is shown. (f), Absence of co-label for Go-ir and TrkA-ir cell populations. (g) Relative radial distance of labeled cells is shown. (h) Number of cells per 10µm horizontal cross section of the olfactory epithelium was analysed for Go-ir and TrkA-ir-positive neurons. (i) Maximal vertical distance (Δ max) of distributions as indicated; ø ratio, diameter ratio; height, normalized laminar height; radius, normalized radial distance; z axis, section number (ordinal). Vertical distance can range between 0 (identical curves) and 1 (no overlap of x value range). Scale bars correspond to 100µm (a) and 10µm (b, c). EXPRESSION / LABELING:
|
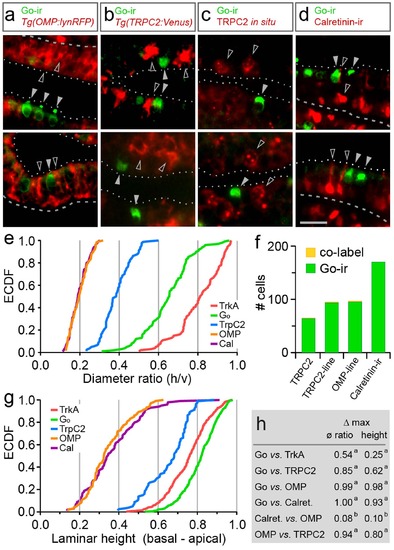
Go-ir-positive neurons do not co-localize with established markers for ciliated and microvillous neurons. (a-d), Double labeling of Go-ir-positive cells with different markers is analysed in horizontal cryostat sections of olfactory epithelia; dashed line, basal border; dotted line, apical border of the sensory layer; scale bar, 20µm. (a) Double fluorescent labeling of anti-Go antibody (green) with RFP (red) expressed in ciliated neurons in Tg(OMP:lyn-mRFP) shows absence of co-localization; filled grey arrowhead, Go-ir-positive cell; open arrowhead, RFP-positive cell. (b) Double fluorescent labeling of anti-Go antibody with Venus expressed in microvillous neurons in Tg(TRPC2:Venus) line shows absence of co-localization. Go-ir signal is set to green, Venus signal is set to red; filled arrowhead, Go -ir-positive cell; open arrowhead, Venus-positive cell. (c) Double fluorescent labeling of anti- Go antibody (green) with in situ hybridisation signal from TRPC2 probe5 shows absence of co-localization; filled grey arrowhead, Go-ir-positive cell; open arrowhead, TRPC2-positive cell. (d) Double fluorescent labeling of anti-Go antibody (green) with anti-calretinin antibody (red) shows absence of co-localization; filled grey arrowhead, Go-ir-positive cell; open arrowhead, calretinin-positive cell. (e) The empirical cumulative distribution function (ECDF) for a cell shape parameter (diameter ratio) shows distributions for TRPC2 and OMP-positive cells to be different from each other as well as from Go-ir and TrkA-ir, shown for comparison here. (f) Quantification of co-label for Go-ir and markers for microvillous, ciliated and crypt neurons (as indicated) shows 0 to 2% co-label (yellow) in Go-ir-positive neurons. Such small percentages amount to a handful of cells in an entire olfactory epithelium, and are likely to accrue from the dense packing of cells, dendrites, cilia and microvilli, at the limit of light-microscopic resolution. (g) The empirical cumulative distribution function (ECDF) for a cell localisation parameter (laminar height) shows distributions for TRPC2 and OMP-positive cells to be different from each other as well as from Go-ir and TrkA-ir-positive cells, shown for comparison here. (h) Maximal vertical distance (Δ max) of distributions as indicated; ø ratio, diameter ratio; height, normalized laminar height. Significance of distribution differences is assessed by Kolmogorov-Smirnov test of the unbinned distributions; a, p < 10-6; b, p > 0.6. EXPRESSION / LABELING:
|

Kappe neurons are tubulin-negative and actin-positive. Double labeling of Go-ir-positive cells with anti-tubulin or anti-actin antibody is analysed in horizontal cryostat sections of olfactory epithelia. (a) Double fluorescent labeling of Go-ir (green) and tubulin (red) shows absence of co-localization; scale bar 10µm. The insets represent magnified images of single neurons taken at 100× magnification, 0.1µm optical sections. (b) Double fluorescent labeling of Go-ir (green) and actin (red) shows co-localization: Go-ir positive neurons exhibit highly localized actin staining at the apical surface of their cell bodies, the expected position for microvilli. Scale bar 10µm. The insets show single neurons, images taken at 100× magnification, 0.1µm optical sections. (c) Quantification of co-label for Go-ir and actin or tubulin, respectively, shows over 90% co-label (yellow) for actin, but less than 10% co-label for tubulin. The small number of Go-ir/tubulin co-labeled cells is likely to result from the dense packing of cells, dendrites, cilia and microvilli, at the limit of light-microscopic resolution. (d) Schematic representation of four types of olfactory sensory neurons with their laminar position. Ciliated neurons (orange) have round somata and slender dendrites that terminate in bundles of cilia on the epithelial surface. They constitue the most basal layer of olfactory sensory neuron. Microvillous neurons (blue) have bundles of microvilli on their apical surface. Crypt neurons (red) are globular-shaped and carry both microvilli and cilia on their apical surface. They are located more apical than microvillous neurons. Go-ir-positive kappe neurons (green) are pear-shaped with an apical appendage resembling a cap (German: Kappe), have no cilia, and are located even more apical than crypt neurons. Kappe neurons (green) constitute a novel olfactory sensory neuron population. EXPRESSION / LABELING:
|