
- Title
-
Sequential and opposing activities of Wnt and BMP coordinate zebrafish bone regeneration
- Authors
- Stewart, S., Gomez, A.W., Armstrong, B.E., Henner, A., and Stankunas, K.
- Source
- Full text @ Cell Rep.

Runx2 and sp7 Define Distinct Populations of Preosteoblasts in Regenerating Fins (A–L) Runx2 (red) and sp7 (green) immunostaining at 24 (A–C), 32 (D–F), 48 (G–I), and 72 (J–L) hr postamputation (hpa) on longitudinal caudal fin sections. Images are maximum intensity projections of confocal z-stacks. Amputation planes are indicated with a dashed yellow line, white arrows point to Runx2+ cells proximal to the amputation site, red arrows indicate Runx2+ cells distal to the amputation site, yellow arrows denote Runx2+/sp7+cells, and green arrows show sp7+ cells. For (I) and (L), regions bound by dashed white boxes are shown in higher magnification in inset panels. (M and N) RNA in situ hybridizations showing runx2a and sp7 expression on fin sections harvested 72 hpa. Red and green arrows point to lateral blastema cells expressing runx2a and sp7, respectively. (O and P) Immunostaining showing Runx2 (red) and sp7 (green) expression (O) and incorporation of EdU (P, white, 6 hr pulse) on 72 hpa fin sections. The white arrow points to an extreme distally located EdU+ blastema cell. The yellow and green arrows indicate Runx2+/EdU+ and sp7+/EdU cells, respectively. Red arrows show high Runx2+/EdU cells. In all overlay images, Hoechst-stained nuclei are shown in blue. The scale bars represent 50 μm. (Q) Quantitation of osteoblast subtypes and EdU incorporation at 72 hpa. Bars show the mean percentile representation of osteoblast subtypes on comparable sections (n = 12 rays, compiled from >4 fish). Error bars are one SD from the mean, and significant p values are indicated with an asterisk (p < 105, Student’s t tests comparing either Runx2+ or Runx2+/sp7+ populations to sp7+ cells). The proportion of each cell population that incorporated EdU is indicated by the extent of gray shading relative to the bar’s height. Fewer sp7+ relative to Runx2+ cells incorporated EdU (p < 0.03, one-tailed Fisher’s exact test, n = 547 Runx2+ and 75 sp7+ cells). |
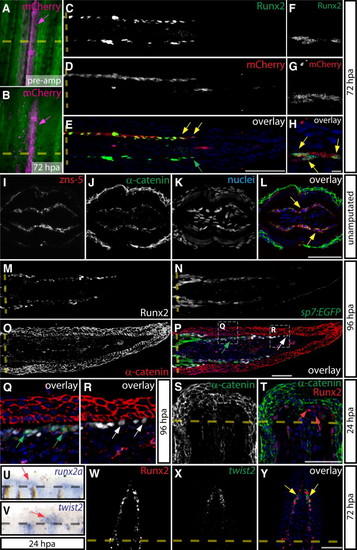
Dual Epithelial/Mesenchymal Nature of Osteoblasts during Fin Regeneration (A–H) Whole-mount imaging of a mosaic bone ray before amputation (A) and at 72 hpa (B) showing osteoblasts permanently labeled by Cre-mediated expression of mCherry (magenta, indicated by magenta arrows). Sections of the same ray at 72 hpa immunostained for Runx2 (C and F) and mCherry (D and G). Overlays are shown in (E) and (H). Yellow arrows show distal mCherry+/Runx2+ cells, and the green arrow points to a mCherry/Runx2+ distal osteoblast (C–H). Amputation sites are indicated with a dashed line. (F)–(H) are high-magnification images of another section through the same ray in (C)–(E). (I–L) Antibody-stained transverse sections of nonregenerating fins showing α-catenin (green) and zns-5 (red). Yellow arrows indicate epithelial α-catenin+/zns-5+ osteoblasts. (M–R) A section from a 96 hpa Tg(sp7:EGFP) fin showing Runx2+ (white), sp7:EGFP (green), and α-catenin (red) expression. Regions bounded by dashed white boxes in (P) are shown at higher magnification in (Q) and (R). White arrows point to Runx2+ preosteoblasts and green arrows show sp7:EGFP+ osteoblasts with membrane-localized α-catenin. (S and T) Expression of Runx2 (red) and α-catenin (green) on 24 hpa sections. Red arrows indicate Runx2+/α-catenin mesenchymal cells. (U and V) Whole-mount RNA in situ hybridizations of runx2a (U) and twist2 (V) at 24 hpa. Red arrows denote the specific expression of runx2a and twist2 in regenerating tissue. (W–Y) Runx2 immunostaining (W, red) and twist2 in situ hybridization (X, green) is shown on 72 hpa frozen sections and overlaid (Y). Yellow arrows point to twist2+/Runx2+ preosteoblasts. Hoechst-labeled nuclei are in blue. Scale bars represent 50 µm except in H, which represents 5 μm. |

Wnt/β-Catenin Signaling in Preosteoblasts during Regeneration (A–L) Immunostaining of Runx2 (red) and β-catenin (green) on fin sections at 24 (A–C), 32 (D–F), 48 (G–I), and 72 (J–L) hpa. Yellow arrows indicate Runx2+ cells with nuclear β-catenin, and the red arrows point to proximal osteoblasts at 72 hpa with membrane-localized β-catenin. For (L), regions bounded by dashed white boxes are shown in higher magnification in inset panels. (M–R) Expression of Runx2 (M, white), sp7:EGFP (O, green), and localization of β-catenin (N, red) is shown and overlaid (P–R) on 96 hpa Tg(sp7:EGFP) section. Regions bound by dashed white boxes in (P) are shown at higher magnification in (Q) and (R). Yellow arrows highlight Runx2+ cells with nuclear-localized β-catenin, and green arrows indicate membrane-localized β-catenin in sp7:EGFP+ osteoblasts. (S–U) A single optical section at 96 hpa fin showing immunostaining of Runx2 (red) and β-catenin (green) in distal preosteoblasts. Yellow arrows point to Runx2+ nuclei containing β-catenin, and the green arrow indicates exclusively membrane-localized β-catenin in the fin epidermis. (V–X) Runx2 immunostaining (V, red) and tcf7 in situ hybridization (W, green) on a 72 hpa cryosection (X, overlay). The yellow arrow indicates distal Runx2+ preosteoblasts that coexpress tcf7; the red arrow indicates proximal osteoblasts lacking tcf7 expression. (Y–AA) Runx2 immunostaining (Y, red) combined with axin2 in situ hybridization (Z, green) is shown on a 72 hpa cryosection and overlaid (AA). Yellow arrows point to distal preosteoblasts coexpressing axin2 and Runx2. The white arrow indicates distal nonosteoblast blastema cells that express axin2. The red arrow shows proximal osteoblasts without axin2 expression. (BB–DD) Runx2 immunostaining (BB, red) and GFP in situ hybridization (CC, green) on a 72 hpa section from a Tg(TOP:GFP) fin shown in overlay (DD). Yellow arrows show Runx2+/GFP+ preosteoblasts. The white arrow indicates distal nonosteoblast blastema cells that express the reporter. Hoechst-stained nuclei are shown in blue. Scale bars represent 50 μm except in U, which represents 5 μm. |
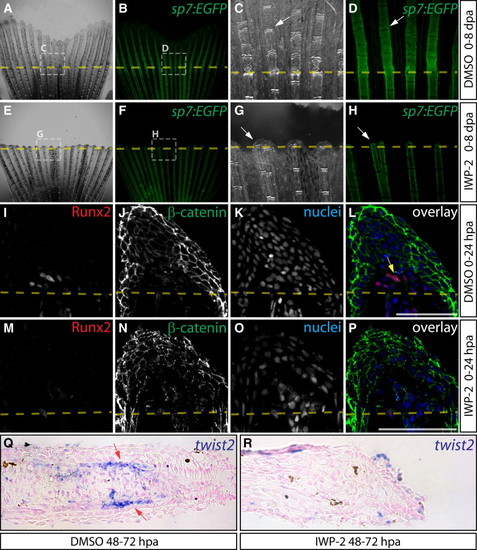
Wnt/β-Catenin Is Required for Osteoblast EMT and Dedifferentiation (A–H) Regeneration of Tg(sp7:EGFP) fins after treatment with DMSO (A–D) or IWP-2 (E–H, 10 μM from 0 to 8 dpa). Rotterman contrast (A, C, E, G) and epifluorescence (B, D, F, H) images show sp7:EGFP expression in osteoblasts (white arrows) before amputation (A, B, E, F) and at 8 dpa (C, D, G, H). Shown are 25× images from one of three fish for control and IWP-2 groups and regions within dashed white boxes are shown at 120× magnification. (I–P) Immunostaining for Runx2 (red) and β-catenin (green) on 24 hpa sections from fish exposed to DMSO (I–L) or Wnt inhibitor (M–P, 10 μM IWP-2 from 0 to 24 hpa). The yellow arrow indicates Runx2+ cells with nuclear-localized β-catenin. Nuclei are stained blue. Scale bars represent 50 μm. (Q and R) twist2 in situ hybridization on fins from DMSO (Q) and IWP-2-treated (R, 10 μM from 48 to 72 hpa) fish harvested 72 hpa. The red arrows point to twist2-expressing osteoblasts. |

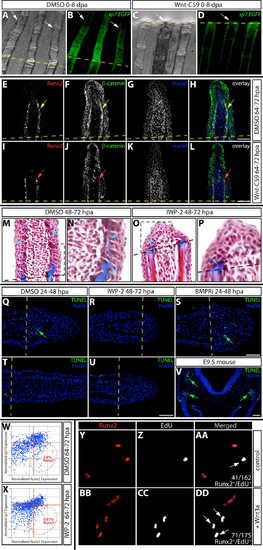
Wnt Is Required for Maintenance of Runx2+ Preosteoblasts during Fin Regeneration (A–D) Runx2 (A–D, red), β-catenin (A and B, green), and sp7 (C and D, green) protein expression on sections from DMSO (A and C) and IWP-2-treated (B and D, 10 μM from 48 to 72 hpa) fish. In (A) and (B), yellow arrows indicate Runx2+ cells with nuclear-localized β-catenin and the red arrow points to a Runx2+ cell lacking nuclear β-catenin. In (C) and (D), red arrows show Runx2+ cells, yellow arrows point to Runx2+/sp7+ cells, and green arrows mark sp7+ cells. (E and F) β-catenin localization at 72 hpa in DMSO (E) and IWP-2-treated fish (F, 10 μM at 64–72 hpa). The osteoblast-populated domain of the blastema is bounded by a dashed white box, and the white arrows point to osteoblasts with β-catenin expression. (G and H) Runx2 (red) and sp7 (green) levels in DMSO (G) and IWP-2-treated fins (H, 10 μM at 64–72 hpa) harvested 72 hpa. Red, yellow, and green arrows indicate Runx2+, Runx2+/sp7+, and sp7+ cells, respectively. Nuclei are in blue. Scale bars represent 50 μm. (I) Osteoblast subtype percentile representation on matched fin sections (n > 6 rays collected from three animals and representing >600 osteoblasts for each treatment) harvested 72 hpa following DMSO (64–72 hpa), Wnt-C59 (100 nM, 64–72 hpa), or IWP-2 (10 μM, 64–72 hpa) exposure. Asterisks indicate significant differences relative to DMSO-treated fish (all p < 0.02, one-tailed Student’s t tests). (J) Percentage of Runx2+ and Runx2+/sp7+ osteoblasts in the same sections scored in (I) that had incorporated EdU. Asterisks indicate a significant decrease (p < 0.003, one tailed Student’s t tests). |

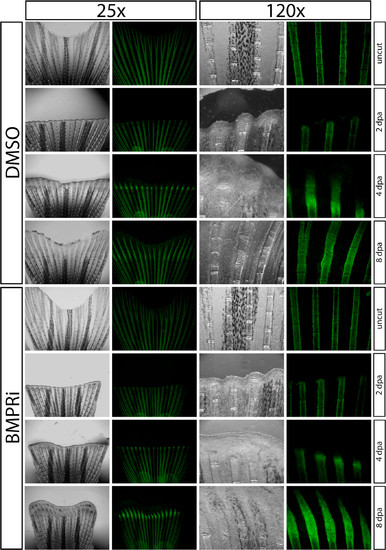
BMP/Smad Signaling Promotes Osteoblast Differentiation and sp7 Expression during Bone Regeneration (A) Runx2 (white), sp7:EGFP (green) and pSmad1/5/8 (red) levels on sections from a Tg(sp7:EGFP) fish 4 dpa. White arrows point to Runx2+/pSmad preosteoblasts. Red arrows indicate sp7+/pSmad1/5/8+ osteoblasts. The amputation site is marked with a dashed yellow line. (B–I) Whole-mount images of regenerating fins of Tg(sp7:EGFP) fish at 8 dpa after DMSO (B–E) or BMPRi exposure (F–I, 5 μM from 0 to 8 dpa). Rotterman contrast (B, D, F, and H) and epifluorescence images (C, E, G, and I) to visualize sp7:EGFP expression (green) are shown. White arrows indicate osteoblasts. Representative images from one of three fish in each of the control and BMPRi groups are shown at low and high magnification. (J–O) Antibody-stained fin sections showing Runx2 (red) and pSmad1/5/8 (green) levels in fish 72 hpa exposed to DMSO (J–L) or BMPRi (M–O, 5 μM BMPRi at 48–72 hpa). Red arrows indicate Runx2+/pSmad cells, and the yellow arrow points to a Runx2low/pSmad1/5/8+ cell. Insets show magnified boxed regions. (P–S) EdU (white) incorporation in Runx2- (red) and sp7- (green) expressing cells in fin sections from DMSO (P and Q) and BMPRi-exposed animals (R and S, 5 μM at 48–72 hpa). Red arrows indicate Runx2+ cells and green arrows point to sp7+ cells. Overlay panels show Hoechst-stained nuclei in blue. Scale bars represent 50 µm. (T) The percentage of Runx2+ (red bars), Runx2+/sp7+ (yellow bars), and sp7+ cells (green bars) in fin sections from DMSO (48–72 hpa) versus BMPRi-treated (5 μM, 48–72 hpa) zebrafish. Four rays from three BMPRi-exposed animals containing a combined >400 osteoblasts were scored. The DMSO sample data are shared with the experiment shown in Figure 5I. Error bars are one SD, and significant p values are indicated with an asterisk (p < 0.002 for increased Runx2+ cells; p < 0.007 for a decrease in Runx2+/sp7+ cells; and p < 0.02 for a decreased sp7+ population, Student’s t tests). |

BMP Negatively Regulates Wnt/β-Catenin Signaling (A–L) Immunostaining (A–E and G–K) with Runx2 (red) and β-catenin (green) antibodies and axin2 in situ hybridization (F and L) on sectioned fins from DMSO (A–F) and BMPRi-treated fish (G–L, 5 μM at 48–72 hpa). Yellow arrows highlight Runx2+ cells with nuclear-localized β-catenin, and red arrows point to osteoblasts with membrane-localized β-catenin. Hoechst-stained nuclei are in blue. For (F) and (L), axin2 expression (blue) in distal osteoblasts is indicated by black arrows. In (L), red arrows point to proximal axin2+ osteoblasts. Scale bars represent 50 μm (A–C and G–I) and 25 μm (D, E, J, and K). (M–R) Runx2 expression (red) and β-catenin localization (green) in antibody-stained primary zebrafish fin osteoblasts grown in media containing DMSO (M–O) or BMPRi + Wnt3a (P–R, 300 nM and 40 ng/ml, respectively) for 24 hr beginning at 4 days postisolation. Green arrows point to cells with nuclear β-catenin localization, and yellow arrows indicate Runx2+ cells displaying nuclear β-catenin. (S) Plots showing nuclear-localized β-catenin versus total cell β-catenin in Runx2+ cells in individual, randomly selected cultured fin osteoblasts following DMSO, Wnt3 (40 ng/ml), or BMPRi + Wnt3a (300 nM and 40 ng/ml, respectively) exposure. A line marks the mean of each group. The Wnt3a + BMPRi population displayed significantly increased nuclear β-catenin relative to the Wnt3A-alone-treated group as determined by one-way ANOVA and a post hoc Tukey’s test (p > 0.01, indicated by an asterisk). |

Spatially Distributed Gene Expression Combined with Negative Feedback Maintains Regenerative Osteogenesis (A) Quantitative RT-PCR analysis of sp7 and dkk genes in primary fin osteoblasts after 24 hr of 300 nM BMPRi (red bars and error bars) relative to control DMSO-treated cells (variation shown with black error bars). For each primer pair, the normalized average fold change in transcript levels upon BMPRi treatment is plotted on a log2 scale with DMSO samples averaged to log20 = 1. Each group includes three independent cultures. Error bars are one SD. Statistically significant differences are indicated with an asterisk (p < 0.05, two-tailed Student’s t tests). A representative example of three independent experiments is shown. (B) Relative gene expression of osteogenic factors and dkk genes at 96 hpa following DMSO (black error bars) or BMPRi exposure (red bars, 5 μM from 48 to 96 hpa). Mean normalized levels of the indicated transcripts from four fins per treatment group are shown on a log2 scale. Error bars represent one SD, and asterisks mark differentially expressed genes (p < 0.05, two-tailed Student’s t tests). (C–H) Antibody staining for Runx2 (red) and β-catenin (green) on sectioned fins from control (C–E, two heat treatments between 48 and 72 hpa) and Tg(hsp70l:dkk1b-GFP) fish (F–H, two heat treatments between 48 and 72 hpa) harvested 72 hpa. The yellow arrow indicates Runx2+ cells with nuclear β-catenin. (I–L) Immunostaining of a 72 hpa fin cryosection with Runx2 (I, white) and sp7 (J, green) antibodies and simultaneous wnt5a mRNA in situ hybridization (K, red), overlaid in (L). The red arrow shows wnt5a expression in distal mesenchymal cells. (M–P) A fin cryosection from a 72 hpa Tg(sp7:EGFP) fish showing antibody staining for Runx2 (M, white) and EGFP (N, green) and bmp2b mRNA in situ hybridization (O, red), overlaid in (P). The white arrow points to Runx2+/bmp2b cells, and yellow arrows indicate overlapping expression of sp7:EGFP and bmp2b. Hoechst-stained nuclei are in blue in overlay panels. Scale bars represent 50 μm. (Q) A signaling network model for osteogenesis during fin regeneration. Wnt acts distally to maintain a pool of Runx2+ osteoblast progenitor cells, whereas Bmp2b-initiated signaling in progenitor-derived cells both promotes sp7-associated differentiation and constrains Wnt activity by inducing Dkk1b. |

Pre-existing osteoblasts generate Runx2+ blastema cells. (A-C) Whole-mount epifluorescence microscopy of a mosaic adult Tg(Xla.ef1a1-actb2:LOXPLOX5171- FRT-F3-EGFP,mCherry); Tg(dusp6:CreERT2,myl7:ECFP) caudal fin mosaic displaying osteoblasts labeled by permanent mCherry expression (magenta) before amputation (A) and at 24 hpa (B). (C) Immunostaining of a section of this fin ray at 24 hpa showing Runx2 (green) and mCherry expression (red) in cells distal to the amputation site (dashed yellow line). Nuclei stained with Hoechst are shown in blue. (D-F) Another Tg(Xla.ef1a1-actb2:LOXPLOX5171- FRT-F3-EGFP,mCherry); Tg(dusp6:CreERT2,myl7:ECFP) osteoblast mosaic visualized by whole-mount epifluorescence microscopy at 25x (D). The region in the dashed box is shown at 120x magnification (E). (F) Immunostaining of a section of this mosaic fin at 48 hpa showing Runx2 (green) and mCherry (red) co-expression. Nuclei are stained with Hoechst (blue). The dashed yellow line marks the amputation plane. Magenta arrows point to the osteoblasts expressing mCherry in mosaic lepidotrichia and yellow arrows indicate the Runx2+/mCherry+ mosaic-derived cells. |

Dual epithelial/mesenchymal nature of osteoblasts during fin regeneration. (A) Immunostaining for the osteoblast lineage marker zns-5 (red) and β-catenin (green) on a transverse section from a non-regenerating fin. Hoechst-stained nuclei are shown in blue. Yellow arrows point to adherens junctions between β-catenin/zns-5 labeled osteoblasts. (B-E) Expression of Runx2 (B, in white), sp7:EGFP (C, in green), and N-cadherin (D, in red) are shown in overlay (E) on 72 hpa fin sections. The white arrow points to distal Runx2+ preosteoblasts lacking N-cadherin expression and yellow arrows indicate sp7+ maturing osteoblasts that display membrane-localized N-cadherin. The yellow dashed line indicates the amputation plane and the scale bar represents 50 μm. (F) Expression of twist2 mRNA (in blue) using in situ hybridization on 72 hpa fin paraffin sections. Red arrows point to distal pre-osteoblasts expressing twist2. (G and H) In situ hybridization to localize expression of twist3 on wholemount fins at 24 hpa. (G) and paraffin sections of 72 hpa fins (H). In (G), red arrows point to cells expressing twist3 (in blue) distal to the amputation site (grey dashed arrow). In (H), red arrows point to distal pre-osteoblasts exhibiting twist3 expression (in blue). Shown are representative images from experiments repeated > 3 times. |

β-catenin localization in the osteoblast lineage during fin regeneration. (A-F) Stitched high-resolution widefield epifluorescence images of a fin section from a 4 dpa Tg(sp7:EGFP) fish immunostained to show Runx2 expression (A, white), β-catenin localization (B, red), and sp7:EGFP reporter activity (C, green). The overlay is shown in (D). Red arrows point to Runx2+ cells containing robust nuclear β-catenin, green arrows indicate sp7:EGFP+ with membrane associated β-catenin, and white arrows point to distal blastema cells with low nuclear β-catenin. The dashed yellow lines show the amputation site. (E, F) High magnification images of the regions bounded by the dashed white boxes in (D) to highlight cell shape in nonregenerating (E) vs. regenerating (F) osteoblasts. Green arrowheads indicate elongated nonregenerating sp7:EGFP+ epithelial osteoblasts. Red and yellow arrows indicate regenerating distal Runx2+ and Runx2+/sp7:EGFP+ cells, respectively, with distinctly rounded morphology. (G-J) Detection of tcf7 (G and H) and axin2 (I and J) expression by in situ hybridization on sections from 72 hpa fins at low (G and I) and high (H and J) magnification. Red arrows point to specific expression of axin2 and tcf7 in distal pre-osteoblasts. The grey dashed line indicates the site of amputation. Shown are representative images indicative of experiments repeated > 6 times. |

Wnt production is required for fin regeneration. Regeneration of caudal fins from Tg(sp7:EGFP) fish exposed to DMSO (upper panels) or 10 μM IWP-2 (lower panels) from 0-8 dpa. Each animal is shown before amputation and at 2, 4, and 8 dpa by Rotterman contrast and epifluorescence to visualize sp7:EGFP expression (green) in osteoblasts at 25x and at 120x magnification. Shown is one of three fish from each treatment group, within which phenotypes were indistinguishable. The experiment was repeated with three independent fish cohorts. |
Wnt/β-catenin signaling is required for fin regeneration by supporting proliferation of Runx2+ pre-osteoblasts. (A-D) Caudal fin regeneration of Tg(sp7:EGFP) zebrafish treated with DMSO (A and B) or 100 nM Wnt-C59 (C and D) from 0-8 dpa. Shown are representative Rotterman contrast (A and C) and epifluorescent images (B and D) from 1 of 3 animals in each treatment group. White arrows point to osteoblasts and the dashed yellow line indicates the amputation site. (E-L) Immunostaining to visualize expression of Runx2 (in red) and β-catenin (in green) on fin sections from control (E-H, DMSO 64-72 hpa) and Wnt-C59 treated fish (I-L, 100 nM 64-72 hpa). Yellow arrows point to Runx2+ pre-osteoblasts with accumulation of nuclear β-catenin; red arrows indicate Runx2+ cells with membrane-localized β-catenin. The scale bar represents 50 μm and the dashed line is the plane of amputation. (M-P) Trichrome staining of control fins (M and N, DMSO from 48-72 hpa) and IWP-2 exposed fins (O and P, 10 μM from 48-72 hpa) at 72 hpa. Blue staining (Aniline Blue) indicates collagen and other connective tissue (blue arrows). The regions bounded by boxes are shown in higher magnification in the adjacent panel. (Q-V) TUNEL staining on fin sections from control (Q and T, DMSO 24-48 hpa), IWP-2 (R and U, 10 μM 48-72 hpa), and BMPRi (S, 5 μM 24-48 hpa) treated fish. A section from an E9.5 mouse is a positive control that serves to demonstrate the distinct labeling of apoptotic cells detected by TUNEL assays. For M-U, a representative ray from one of three fish in each treatment group is shown, with at least three rays examined from each animal. Green arrows indicate TUNEL+ cells. The dashed yellow lines represent the amputation plane. Scale bars are 50 μm. (W and X) Scatter plots showing numbers of Runx2+, Runx2+/sp7+ and sp7+ cells in DMSO (W) or IWP-2 treated animals (X, 10 μM 64-72 hpa). Each point on the plots represents a single cell’s normalized expression levels for Runx2 (x-axis) and sp7 (y-axis). Scored cells are from at least 10 sections from 4 different animals for each treatment. Regions bounded by the dashed red ellipse are defined as Runx2+ cells and the percentage of Runx2+ cells within the bounded region is shown. (Y-DD) Runx2 expression (Y and BB) and EdU incorporation (Z and CC) in cultured primary fin osteoblasts in response to Wnt3a treatment. Overlay images are shown in AA and DD. White arrows indicate Runx2+/EdU+ cells. Results are representative of two independent cell preparations and three independent Wnt3a treatments. In each case p < 0.05 (one tailed Fisher’s test) comparing the fraction of EdU-incorporated Runx2+ cells in control vs. Wnt3a treated cells. |
BMP receptor signaling is required for regeneration. Regeneration of caudal fins from Tg(sp7:EGFP) animals exposed to DMSO (upper panels) or BMPRi (lower panels, 5 μM at 0-8 dpa). Images show the progression of regeneration in an individual fish before amputation and at 2, 4, and 8 dpa using Rotterman contrast and epifluorescence to visualize sp7:EGFP expression (green) in osteoblasts at 25x and 120x magnification. One of three fish, which all behaved similarly, from the two treatment groups are shown. The experiment was repeated using three independent sets of animals. |

BMP signaling is essential for bone formation. (A-D) Immunostaining of a 48 hpa fin section with pSmad 1/5/8 (green) and Runx2 (red) antibodies. The red arrow points to Runx2+/pSmad- pre-osteoblasts localized in the distal blastema. Yellow arrows indicate Runx2low/pSmad+ cells. Nuclei are stained with Hoechst (blue) and the dashed line is the amputation plane. The scale bar is 50 μm. (E-H) Fin regeneration in Tg(sp7:EGFP) animals treated with DMSO (E and F) or BMPRi (G and H, 5 μM) from 0-4 dpa. Shown are representative whole-mount Rotterman contrast (E and G) and epifluorescent images (F and H) from one of the three animals in each group. Yellow arrows mark osteoblasts and the amputation site is indicated with a dashed line. (I-L) Von Kossa staining of frozen sections to detect calcified bone in control (I and J) and BMPRi-treated (K and L) fish. Black arrows point to calcified tissue (stained black) distal to the site of amputation (dashed yellow line); blue arrows point to regions rich in mucopolysaccharides (stained blue). The regions bounded by boxes are shown in higher magnification in the adjacent panel. Shown are representative examples from one of three fish for each treatment. (M and N) col10a1 in situ hybridization on DMSO (M) and BMPRi treated (N) fins. Red arrows point to regions of gene expression stained blue. (O and P) Immunostaining of sections from Tg(sp7:EGFP) animals treated with DMSO (O) or 5 μM BMPRi (P) from 0-72 hpa) to demonstrate Runx2 (white) and sp7:EGFP (green) expression and levels of pSmad1/5/8 (red). Hoechst-stained nuclei are shown in blue. White arrows indicate Runx2+ cells and yellow arrows show sp7:EGFP+/pSmad+ cells. The dashed yellow line indicates the amputation site. A representative section from one of three fish in each group is shown. Three or more rays were examined for each animal. (Q) EdU incorporation in osteoblast sub-types under DMSO or BMPRi conditions. No significant difference was observed (p > 0.05, two-tailed Student’s t-tests). (R-U) Runx2 (red) and pSmad1/5/8 (green) immunostaining of primary cultured fin osteoblasts. Hoechst stained nuclei are shown in blue and the yellow arrows point to Runx2+ osteoblasts displaying pSmad1/5/8 immunoreactivity. For each treatment, at least 400 osteoblasts were examined from more than six comparable sections compiled from three different animals. (V) qRT-PCR analysis demonstrating relative transcript levels of bmp2a, bmp2b, bmp4 and bmp6 in cultured fin osteoblasts. Equal amounts of template were used for each reaction and relative expression levels were determined by normalizing to rpl8 expression. Mean relative expression levels from three independent cultures are shown and the error bars indicate one standard deviation. |

Localization of Wnt and BMP signals during fin regeneration. (A and B) In situ hybridization using a dkk3b probe on 72 hpa fins from control (A, DMSO 48- 72 hpa) and BMPRi (B, 5 μM, 48-72 hpa) treated fish. (C-F) Expression of bmp2b (C), wnt5a (D), wnt5b (E), and wnt10a (F) by in situ hybridization on paraffin sections from 72 hpa fin, shown at low and high magnification. The black arrows indicate osteoblasts, red arrows point to distal blastema mesenchymal cells, and green arrows mark basal epidermal cells. |