
- Title
-
Dynamics of Sonic hedgehog signaling in the ventral spinal cord are controlled by intrinsic changes in source cells requiring Sulfatase 1
- Authors
- Al Oustah, A., Danesin, C., Khouri-Farah, N., Farreny, M.A., Escalas, N., Cochard, P., Glise, B., and Soula, C.
- Source
- Full text @ Development

Sulf1 depletion impairs OPC development in zebrafish. A-H show side views of whole embryos at the level of the trunk spinal cord; anterior to the left and dorsal to the top. J-L show transverse spinal cord sections, dorsal to the top. (A-C) Detection (A,B) and quantification (C) of dorsal OPCs (arrows) at 48 hpf in Tg(olig2:GFP) embryos injected with ctrlMO (A) and sulf1MO (B). (D-F) Detection (D,E) and quantification (F) of dorsal OPCs (arrows) at 72 hpf in Tg(nkx2.2a:mEGFP;olig2:dsRed2) larvae injected with ctrlMO (D) and sulf1MO (E). (G,H,J-L) Expression of mbpa at 72 hpf in larvae injected with sulf1 mismatch MO (G) and sulf1MO (H) and in wild-type (J), sulf1sa199+/- (K) and sulf1sa199-/- (L) larvae. (I,M) Quantification of mbpa+ cells in transverse sections of morphants (I) and sulf1sa199+/- incross progeny (M). Results are presented as mean number of cells ± s.e.m. (**P<0.01, ***P<0.001, ****P<0.0001; ns, non-significant). Brackets indicate position of the dorsal spinal cord. Scale bars: 100 μm (A-H), 50 μm (J-L). EXPRESSION / LABELING:
PHENOTYPE:
|

Sulf1 depletion impairs generation of ventral neuronal subtypes. Side views of whole embryos at the level of the trunk spinal cord, anterior to the left and dorsal to the top. (A-H) Detection (A-F) and quantification (G,H) of tal2-expressing neurons at 24 hpf in embryos injected with ctrlMO (A), sulf1 mismatch MO (B) and sulf1MO (C) and in wild-type (D), sulf1sa199+/- (E) and sulf1sa199-/- (F) embryos. (I-Q) Detection and cell counts of sim1+ (I-K), islet2a+ MNs (L-N) and pax2a+ dorsal neurons (O-Q) in embryos injected with ctrlMO (I,L,O) and sulf1MO (J,M,P). Results are presented as mean number of cells ± s.e.m. (*P<0.05, **P<0.01). Scale bars: 100 μm. |
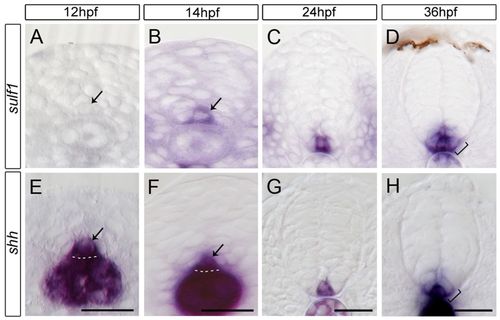
Sulf1 is specifically upregulated in shh-expressing MFP and LFP cells at the two critical time points of neuronal and OPC generation. Transverse sections through trunk spinal cord are shown; dorsal to the top in all panels. (A-H) Temporal expression of sulf1 (A-D) and shh (E-H). At 12 hpf, MFP (arrows) expresses shh (E) but not sulf1 (A). From 14 hpf, both transcripts are detected in MFP cells (arrows, B,F). At 36 hpf, sulf1 (D) and shh (H) are expressed in MFP and LFP (brackets). Dashed lines outline the ventral border of the neural tube. Scale bars: 20 μm. EXPRESSION / LABELING:
|
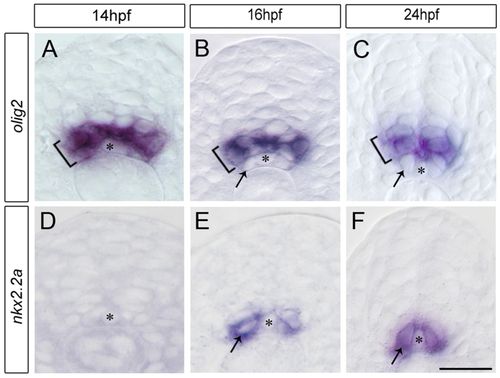
Sequential expression of olig2 and nkx2.2a in the zebrafish neural tube. (A-F) Expression of olig2 (A-C, brackets) and nkx2.2a (D-F) on transverse sections of 14 hpf (A,D), 16 hpf (B,E) and 24 hpf (C,F) embryos. Expression of nkx2.2a is detected from 16 hpf (E,F) in cells (arrows) abutting the MFP, which at the same time downregulate olig2 (BC). Asterisks in all panels mark the MFP. Scale bar: 20 μm. EXPRESSION / LABELING:
|
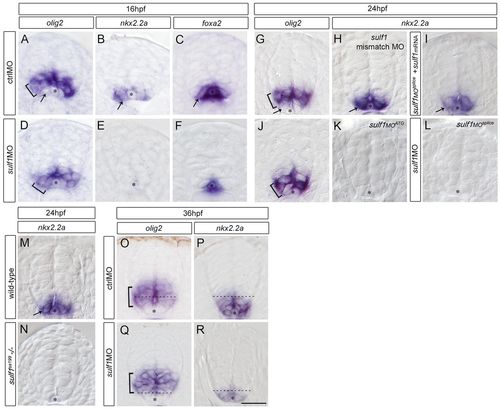
Sulf1 is required for correct temporal establishment and rearrangement of ventral neural patterning. (A-F) Expression of olig2 (A,D), nkx2.2a (B,E) and foxa2 (C,F) in transverse sections at 16 hpf in ctrlMO-injected (A-C) and sulf1MO-injected (D-F) embryos. Injection of ctrlMO does not affect expression of olig2 (A), nkx2.2a (B) and foxa2 (C), but injection of sulf1MO prevents upregulation of nkx2.2a (E) and foxa2 (F) as well as the dorsal shift of the olig2+ domain (D). (G-L) Expression of olig2 (G,J) and nkx2.2a (H,I,K,L) at 24 hpf in embryos injected with ctrlMO (G), mismatch MO (MisMO, H), sulf1MOATG (K), sulf1MOsplice (L) and co-injected with sulf1MOsplice and sulf1 mRNA (I). (M,N) Expression of nkx2.2a at 24 hpf in wild-type (M) and sulf1sa199-/- (N) embryos. (O-R) Expression of olig2 (O,Q) and nkx2.2a (P,R) at 36 hpf in embryos injected with ctrlMO (O,P) and sulf1MO (Q,R). Brackets indicate position of the olig2+ domain, arrows point to nkx2.2a+ cells and stars mark the MFP in all panels. Dashed lines in O-R indicate dorsal boundary of the nkx2.2a+ domain. Scale bar: 20 μm. EXPRESSION / LABELING:
PHENOTYPE:
|

Expression of shh is unaffected in sulf1-depleted embryos. (A-F) Expression of shh in ctrlMO-injected (A-C) and sulf1MO-injected (D-F) embryos at 16 hpf (A,D), 24 hpf (B,E) and 36 hpf (C,F). (G-J) Detection of GFP at 24 hpf (G,I) and 36 hpf (H,J) in ctrlMO-injected (G,H) and sulf1MO-injected (I,J) Tg(shh:GFP) embryos. Dashed lines outline the spinal cord. Scale bar: 20 μm. EXPRESSION / LABELING:
|
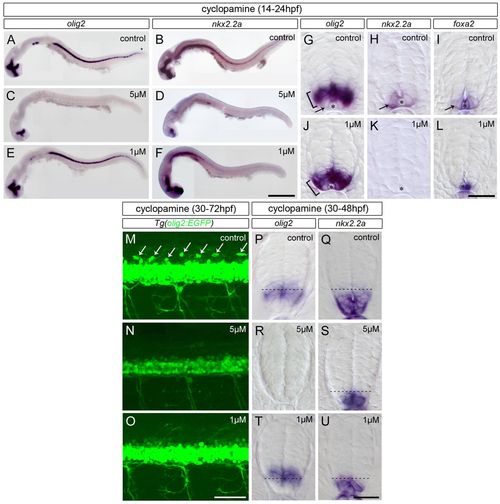
Partial inhibition of Hh signal transduction prior to each step of patterning progression is sufficient to prevent the correct temporal formation of the p3 and p* domains. Panels A-F and M-O show side views of whole embryos; all other panels show spinal cord transverse sections. (A-L) Expression of olig2 (A,C,E; brackets in G,J), nkx2.2a (B,D,F; arrow in H,K) and foxa2 (I,L) at 24 hpf in embryos incubated from 14 hpf in control solution (A,B,G-I) or in cyclopamine at 5 μM (C,D) or 1 μM (E,F,J-L). Note that 1 μM cyclopamine-treated embryos express olig2 (J) but not nkx2.2a (K) and foxa2 (L) in cells abutting the MFP (asterisks). (M-O) Detection of GFP at 72 hpf in Tg(olig2:EGFP) larvae incubated from 30 hpf in control solution (M) or in cyclopamine at 5 μM (N) and 1 μM (O). (P-U) Expression of olig2 (P,R,T) and nkx2.2a (Q,S,U) at 48 hpf in embryos incubated from 30 hpf in control solution (P,Q) or in cyclopamine at 5 μM (R,S) or 1 μM (T,U). Dashed lines indicate dorsal boundary of the nkx2.2a+ domain. Scale bars: 200 μm in A-F; 50 μm in M-O; 20 μm in G-L,P-U. EXPRESSION / LABELING:
PHENOTYPE:
|

Sulf1 depletion prevents up-regulation of nkx2.9 at 24hpf without affecting expression of arx and pax7 in MFP and dorsal neural cells, respectively. (A-F) Expression of nkx2.9 (A,D), arx (B,E) and pax7a (C,F) on transverse sections of ctrlMO- (A-C) and sulf1 MO- (D-F) injected embryos at 24hpf. Asterisks in all panels mark MFP. Scale bar=20μm. EXPRESSION / LABELING:
|
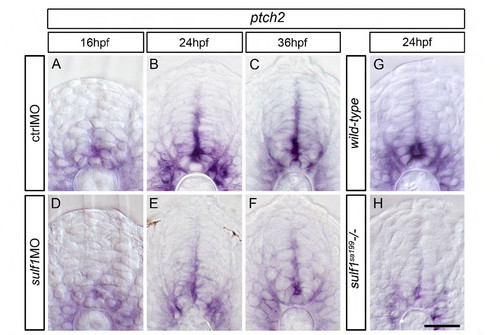
Shh signaling activity is reduced in sulf1-depleted zebrafish embryos. (A-F) Expression of ptch2 at 16hpf (A,D), 24hpf (B,E) and 36hpf (C,F) in embryos injected with ctrlMO (A-C) and sulf1MO (D-F). (G,H) Expression of ptch2 at 24hpf in wild-type (G) and sulf1sa199-/- (H) embryos. Note reduction in ptch2 expression both in sulf1MO-injected and sulf1sa199-/- embryos at 24hpf. Scale bar = 20μm. EXPRESSION / LABELING:
PHENOTYPE:
|