
- Title
-
An anterior limit of FGF/Erk signal activity marks the earliest future somite boundary in zebrafish
- Authors
- Akiyama, R., Masuda, M., Tsuge, S., Bessho, Y., and Matsui, T.
- Source
- Full text @ Development
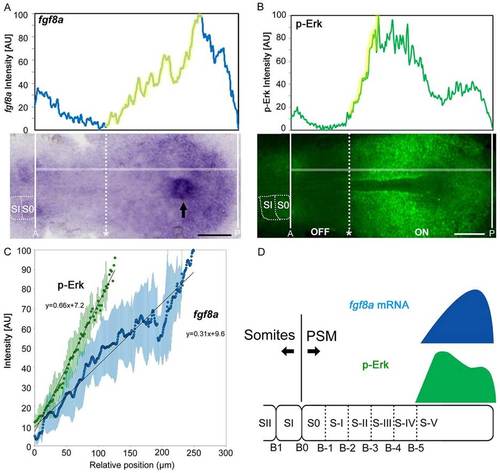
fgf8a mRNA shows graded distribution in the PSM, whereas FGF downstream signal activity, represented by p-Erk levels, does not. (A,B) Representative images of fgf8a expression (A) and p-Erk distribution (B) showing a gentle slope and a steep gradient, respectively. Signal intensities (graphs; AU, arbitrary unit) were measured by ImageJ software from the original images. Anterior and posterior ends of the PSM are marked by white lines. The position of the anterior extremity (dotted lines) was estimated by comparison of signal intensity (upper panel) and visual observation (lower panel). Dorsal view of tailbud regions in flat-mounted embryos, anterior to the left. The horizontal white lines in the lower images mark the paths along which the signal intensities shown in the upper panel were recorded. Arrow indicates Kupffer’s vesicle. Scale bars: 100 µm. (C) Comparison of slopes between fgf8a expression and p-Erk distribution. Intensity plots of the upward slope regions of the gradients represented by the yellow line in the graphs in A and B. Approximation formulae of fgf8a (n=8) and p-Erk (n=7) were calculated from average values of signal intensities, respectively. Dots indicate averages and green/blue bars indicate s.d. (D) Schematic of the distribution of fgf8a mRNA (blue) and p-Erk (green). B, boundary; PSM, presomitic mesoderm; S, somite. Prospective somites and future somite boundaries in the PSM are numbered as described by Pourquié and Tam (Pourquié and Tam, 2001). EXPRESSION / LABELING:
|

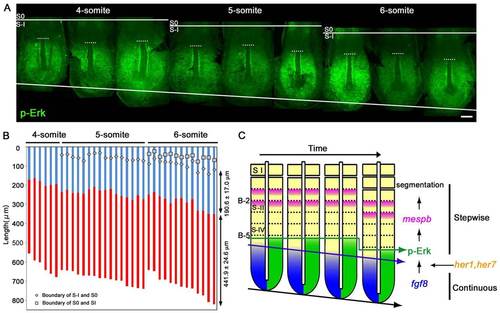
A continuous pattern of fgf8a mRNA is converted into a stepwise pattern of p-Erk during each somite segmentation. (A) Representative images of fgf8a expression in the tailbud regions of embryos at the 3- to 5-somite stages. The position of the anterior extremity of fgf8a expression is indicated by the dotted line. (B) Representative images of p-Erk distribution in the tailbud regions of embryos at the 3- to 5-somite stages. Dorsal view of tailbud regions, anterior to the top. (C,D) Quantitative data of fgf8a expression (C) or p-Erk distribution (D). Embryos (C, n=29; D, n=39) were arranged in order of time progression, which was estimated by both the somite number and the PSM length. In C, red and blue stripes within each column indicate expression and non-expression domains of fgf8a in each embryo, respectively. Statistical significance of variation (2P<0.05) could be seen in fgf8a expression region (C.V.=0.033) versus fgf8a non-expression region (C.V.=0.090). In D, red and blue stripes within each column indicate ON and OFF regions of Erk activity in each embryo, respectively. Scale bars: 100 µm. Statistical significance of variation (2P<0.05) could be seen in the OFF region (C.V.=0.024) versus the ON region (C.V.=0.038). EXPRESSION / LABELING:
|

The anterior limit of Erk activity marks the future somite boundary at B-5. (A) Schematic of the experimental design. (B,C) Representative images of p-Erk distribution in 2-, 3- and 5-somite-stage embryos treated with DMSO (vehicle; B) or BCI (C). The B-1 position is marked by a white line. The anterior limit of Erk activity is indicated by a white dotted line. In BCI-treated embryos, p-Erk signals were highly activated and expanded to the anterior only at the 2-somite stage (C). (D,E) Representative images of mesp-b expression in 2-, 3- and 5-somite stage embryos treated with DMSO (D) or BCI (E). Although p-Erk signals were altered immediately after BCI treatment (C), mesp-b expression changed only in S-I (brackets) of 5-somite stage embryos, which would generate a smaller 7th somite as shown in G. (F,G) Representative images of 10-somite-stage embryos treated with DMSO (F) or BCI (G). BSI treatment at the 2-somite stage led to decreased size of 7th somite (G). Scale bars: 100 µm. |
Double knockdown of her1 and her7 leads to loss of stepwise p-Erk pattern during somite segmentation. (A) Representative images of p-Erk distribution in embryos at the 4- to 6-somite stages. Dorsal view of the tailbud region, anterior to the top. Scale bar: 100 µm. (B) Quantitative data of p-Erk distribution in her1 and her7 morphants (n=35). Red and blue stripes within each column indicate ON and OFF regions, respectively, of p-Erk activity in each embryo. Statistical significance of variation (2P>0.05) could not be seen in the OFF region (C.V.=0.089) versus the ON region (C.V.=0.056). (C) Generation of the future somite boundary at B-5. The fgf8a mRNA gradient progresses continuously towards the posterior at the same rate as elongation of the PSM, whereas the activity of p-Erk, downstream of FGF signalling, exhibits a stepwise pattern during each somite segmentation. This pattern is generated by a mechanism depending on the somite segmentation clock in zebrafish. The anterior limit of Erk activity represents the positioning of the future somite boundary at B-5; p-Erk is therefore an earlier molecular marker of the future somite boundary than mesp-b, a determinant of the future somite boundary at B-2. EXPRESSION / LABELING:
PHENOTYPE:
|

ZFIN is incorporating published figure images and captions as part of an ongoing project. Figures from some publications have not yet been curated, or are not available for display because of copyright restrictions. EXPRESSION / LABELING:
PHENOTYPE:
|
|
ZFIN is incorporating published figure images and captions as part of an ongoing project. Figures from some publications have not yet been curated, or are not available for display because of copyright restrictions. EXPRESSION / LABELING:
|
|
ZFIN is incorporating published figure images and captions as part of an ongoing project. Figures from some publications have not yet been curated, or are not available for display because of copyright restrictions. PHENOTYPE:
|