
- Title
-
Endocytosis of Fgf8 is a double-stage process and regulates spreading and signaling
- Authors
- Rengarajan, C., Matzke, A., Reiner, L., Orian-Rousseau, V., and Scholpp, S.
- Source
- Full text @ PLoS One

Hsc70 regulates the Fgf8 signaling range. (A–L) In situ hybridization for Fgf target genes erm and pea3 at 75% epiboly stage. Embryos were mounted laterally with animal pole to the top and dorsal region towards the left. The area of the expression domains of Fgf target genes erm and pea3 were investigated in embryos injected with indicated constructs and the border of the expression domains were marked by arrows. (E, F, K, L) show embryos co-treated with 16 μM of the Fgf signaling inhibitor SU5402. Fluorescent ISH for target gene expression pea3 is shown in (M–O). As an in-vivo reporter for Fgf signaling, the expression of Dusp6-EGFP in live zebrafish embryos at 50% epiboly stage was investigated (P–R). The area of expression of target genes erm and pea3 (A–L) was quantified in 10 embryos for each experiment (S). |

Fgf8 uptake is regulated by Hsc70. Confocal analysis of live embryos at 50% epiboly stage at the animal pole. Fgf8-GFP DNA was injected along with the red membrane marker mCherry at the one cell stage to determine subcellular localization of Fgf8 in embryos co-injected with indicated constructs (A–E′′). The range of Fgf8 propagation in the receiving tissue was analyzed using confocal microscopy (F–H) and the distance spread by Fgf8 was quantified (I). Quantification of the average intensity of Fgf8-GFP is demonstrated in embryos (J). For quantification 7 different embryos were used for each experiment. |

Analysis of Fgf8 internalization Clathrin coated vesicles and early endosomes in fish fibroblasts. Confocal analysis of Fgf8-GFP co-localization with indicated early endocytic markers in zebrafish PAC2 cells. Columns 1-3 show confocal images and columns 4-5 shows bright field images merged with the confocal image. Co-localization of Fgf8 with Clathrin (A-D′) and with Rab5 (E-H′) was investigated. Furthermore, insets show the increasing size of Rab5 positive early endosomes upon Hsc70 overexpression (E and G). |
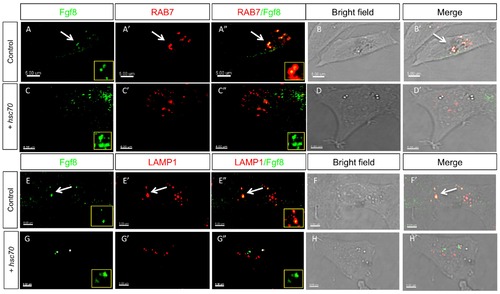
Analysis of Fgf8 internalization in late endosomes and lysosomes in fish fibroblasts. Confocal analysis of Fgf8-GFP localization in zebrafish PAC2 cells. Columns 1–3 show confocal images and columns 4-5 shows bright field images merged with the confocal image. Co-localization with late endosomal markers was investigated: with Rab7 (A-D′) and the lysosomal Lamp1 (E-H′). |

Inhibition of Fgf8 transport from early to late endosome does not alter signaling range. Analysis of localization of Fgf8-GFP during inhibition of endocytic transport from early to late endosomes by treatment with Bafilomycin A1. Embryos were injected with Fgf8-GFP along with the early endosomal marker Rab5 or membrane marker mCherry at one cell stage, treated with 100 nM Bafilomycin A1 at 30% epiboly stage for a period of 1 hr and subjected to live imaging using confocal microscopy at 50% epiboly stage. At 75% epiboly stage embryos were fixed and stained for erm expression by ISH. Circle highlight co-localization of Rab5 and Fgf8, white arrows point to typical Fgf8 localizations, and balck arrows visualize the extend of the pea3 expression domain. |

A. Immunoblot analysis of the expression of Hsc70 protein during knockdown and over expression of Hsc70. Embryos were injected with Hsc70 morpholinos as well as Hsc70 mRNA and samples at 28hpf were subjected to immunoblot analysis. Embryos injected with Hsc70 MOs showed a reduction in the expression of Hsc70 when compared to the expression in wild type samples. Embryos overexpressing Hsc70 showed an increase in the expression of Hsc70 when compared to the expression in the wild type. ISH for Fgf8 expression. (B) Shows the expression of Fgf8 at 75% epiboly stage. Fgf8 expression remains unaltered during overexpression (C), knock-down of Hsc70 (D), and injection of Hsc70 MO and mRNA (E). |
Injection procedure to measure the distance of Fgf8 distribution. Figure shows the schematic diagram of the experiment performed to analyze the spreading of Fgf8 from its source. (A) Fgf8 GFP DNA was injected into live zebrafish embryos at the one cell stage. (B) Zebrafish embryo at 50% epiboly stage show a mosaic expression of Fgf8. (C) Confocal microscopy analysis of live embryos show Fgf8 expressed in specific cells creating local sources from which the distance travelled by Fgf8 from the source to receiving cells is measured (e.g. a,b). |