
- Title
-
Genome wide expression profiling during spinal cord regeneration identifies comprehensive cellular responses in zebrafish
- Authors
- Hui, S.P., Sengupta, D., Lee, S.G., Sen, T., Kundu, S., Mathavan, S., and Ghosh, S.
- Source
- Full text @ PLoS One
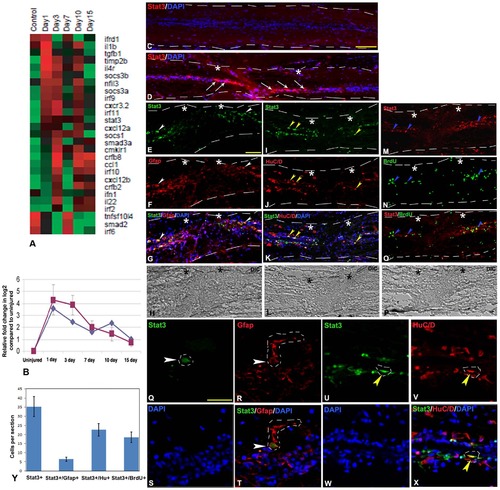
Differentially expressed genes related to inflammatory response and validation of stat3 expression in uninjured and injured zebrafish spinal cord. A) Dendrogram representing genes related to regulation of inflammation. Each horizontal line indicates the expression pattern of each gene and the vertical columns indicate the uninjured control and time points after SCI. The color chart indicates mean fold change of gene expression in each time points. Red and green colors represent increased and decreased expression respectively. B) Quantitative RT-PCR of stat3 expression showing fold change (red graph) and pattern of expression at different time points after injury. The temporal expression pattern of qRT-PCR (red graph) was compared with results of microarray analysis (blue graph). Error bars represent SEM, n = 3, p<0.01. C) A longitudinal section of uninjured cord stained with STAT3 and DAPI. D) A longitudinal section of 1 dpi cord showing many STAT3 positive cells (white arrows) close to the injury epicenter (double white stars) counter stained with DAPI. E–H) A longitudinal section of 3 dpi cord double stained with STAT3 and radial glial marker- GFAP, showing individual panels of STAT3 (E), GFAP (F), merge with DAPI (G) and DIC (Differential interference contrast) (H). A few STAT3+ cells are colocalized with GFAP+ cells (white arrowheads) close to injury epicenter. I–L) A longitudinal section of 3 dpi cord showing colocalization of STAT3 and newly formed neuronal marker, HuC/D with individual panels of STAT3 (I), HuC/D (J), merge with DAPI (K) and DIC (L). Some of the STAT3+ cells are colocalized with HuC/D+ cells (yellow arrowheads) close to the injury epicenter. M–P) A longitudinal section of 3 dpi cord colocalized with STAT3 and proliferating cell marker, BrdU shows individual panels of STAT3 (M), BrdU (N), merge (O) and DIC (P). Proliferating BrdU+ cells are also colocalized with STAT3+ cells (blue arrowheads) close to the injury epicenter. White dashed line in panel C to P mark the boundary of spinal cord tissue. Q–T) A representative higher magnification of 3 dpi cord section shows individual panels like STAT3 (Q), GFAP (R), DAPI (S) and merge (T). A STAT3+ cell (white arrowhead; the boundary of the cell nucleus is markedby white dashed line) is colocalized with GFAP+ radial glia (white arrowhead; the boundary of the cytoplasm of radial glia is marked by white dashed line). U–X) A representative higher magnification of 3 dpi cord section shows individual panels like STAT3 (U), HuC/D (V), DAPI (W) and merge (X). A STAT3+ cell (yellow arrowhead; the boundary of the cell nucleus is marked by white dashed line) is colocalized with HuC/D+ newly formed neuron close to ependyma (yellow arrowhead; the boundary of the cell nucleus is marked by white dashed line). Y) Quantitative analysis of STAT3+, STAT3+/GFAP+, STAT3+/HuC/D+ and STAT3+/BrdU+ cells in 3 dpi cord in longitudinal sections. The value represented as Mean±SEM of individual longitudinal section, n = 5 cord, p<0.01.Scale bar = 200 µm (C–D); 50 µm (E–P), 20 µm (Q–X). EXPRESSION / LABELING:
PHENOTYPE:
|
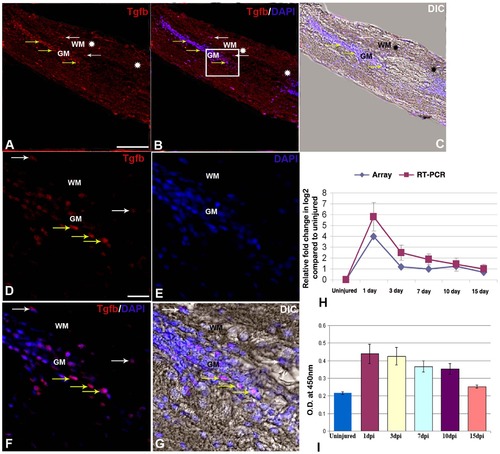
TGFβ expression in uninjured and injured zebrafish spinal cord. A) A longitudinal section of 1 dpi cord showing TGFβ positive cells in both grey matter (GM, yellow arrows) and white matter (WM, white arrows) of the cord at injury epicenter (double white star) and adjacent part. B) Same section merged with DAPI. C) Same section merged with DIC. D–G) Higher magnification of the boxed area of the section in B showing many TGFβ positive cells in both grey matter (GM, yellow arrows) and white matter (WM, white arrows) regions of the cord represented in individual panels of TGFβ (D), DAPI (E), merge of both (F) and merge with DIC (G). H) Quantitative RT-PCR of tgbβ1 expression showing fold change (red graph) and pattern of expression at different time points after injury. The temporal expression pattern of qRT-PCR (red graph) was compared with results of microarray analysis (blue graph). Error bars represent SEM, n = 3, p<0.05. I) Quantification of TGFβ expression in uninjured and injured cord at different time points by ELISA. Error bars represent SEM, n = 5, p<0.01.Scale bar = 50 µm (A–C); 10 µm (D–G). |

ZFIN is incorporating published figure images and captions as part of an ongoing project. Figures from some publications have not yet been curated, or are not available for display because of copyright restrictions. |
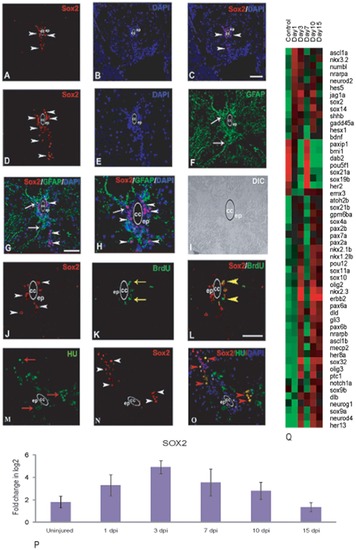
Differentially expressed genes involved in neurogenesis and neuronal differentiation after injury in zebrafish spinal cord and validation of Sox2 expression by immunohistochemistry and qRT-PCR analysis. A–C) A cross section of uninjured cord showing SOX2 positive cells (white arrowhead) in ependyma (ep) around the central canal (cc), counter stained with DAPI (B) and merge (C). D) A cross section of 3 dpi cord showing higher number of SOX2 positive cells compared to uninjured (A) in grey matter (white arrowhead) mostly in ependyma (ep) around the central canal (cc). E–F) Same 3 dpi cord section counter stained with DAPI (E) and stained with radial glial marker GFAP (F). G) Same 3 dpi cord section showing both SOX2 positive cells (arrowheads) and their colocalization with GFAP (arrow). H) Same section (G) in higher magnification showing colocalized SOX2 and GFAP positive cells (arrow) around the central canal (cc), I) DIC of same section in H. J–L) 3 dpi cord section showing SOX2 positive cells (J, arrowheads) and BrdU positive cells (K, yellow arrow) in the grey matter and many of them are SOX2+/BrdU+ (L, yellow arrowheads) in ependyma (ep) around the central canal (cc). M–O) A 3 dpi cord section showing many HuC/D positive neuronal cells (M, red arrow) and SOX2 positive cells (N, white arrowheads) in the grey matter. Same section showing colocalization of SOX2 and HuC/D (O, red arrowheads). P) qRT-PCR of sox2 in uninjured cord and in injured cord at different time points. Error bars represent SEM, n = 3, p<0.05. Q) Dendrogram showing differentially expressed genes involved in neurogenesis and neuronal differentiation after injury. Each horizontal line indicates the expression pattern of each gene and the vertical columns indicate the uninjured control and time points after SCI. The color chart indicates mean fold change of gene expression in each time points. Red and green colors represent increased and decreased expression respectively. Scale bar = 50 µm (A–G and M–O), 20 µm (H–L). |
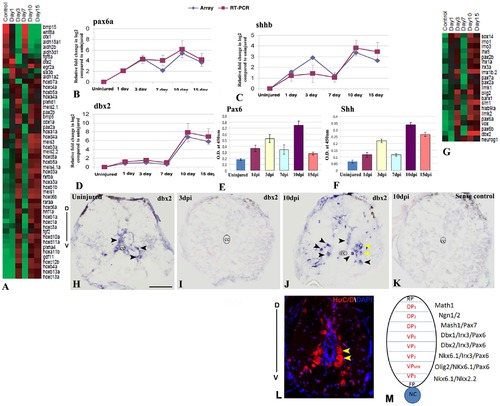
Differential expression of pattern forming genes during zebrafish spinal cord regeneration and validations of pax6a, shhb and dbx2. A) Represents known genes related to anterio-posterior patterning in CNS that are differentially expressed at different time points after SCI. The color chart indicates mean fold change of gene expression in each time points. Red and green colors represent increased and decreased expression respectively. B–D) Quantitative RT-PCR analysis of pax6a, shhb and dbx2 respectively showing fold change and differential pattern of expression in various time points after injury and compared with the temporal expression patterns of microarray data. Error bars represent SEM, n = 3, p<0.01. E–F) Quantitative analysis of PAX6 and SHH expression by ELISA in uninjured and injured cord at different time points. Error bars represent SEM, n = 5, p<0.001. G) Represents known genes related to dorso-ventral patterning in CNS that are differentially expressed at different time points after SCI. The color chart indicates mean fold change of gene expression in each time points. Red and green colors represent increased and decreased expression respectively. H–K) In situ hybridization of dbx2 in uninjured (H), 3 dpi (I) and 10 dpi (J) cord section shows presence of dbx2 transcripts in few neurons (black arrowheads) in uninjured cord but complete absence of dbx2 transcripts in 3 dpi cord and reappearance of dbx2 transcripts in many neurons in 10 dpi cord (black arrowheads). Significantly, higher numbers of dbx2 positive cells are present in the ventral side of the 10 dpi cord compared to uninjured cord. Yellow arrows indicate neurons of ventral progenitor domain. Section in K represents sense control of dbx2 in a 10 dpi cord. The mark ‘cc’ denotes central canal of the cord. ‘D’ and ‘V’ indicates dorsal and ventral side of the cord respectively. L) Representative transverse section of 10 dpi cord stained with HuC/D and DAPI showing the distribution of regenerated neurons in the dorso-ventral axis of the cord. Yellow arrows indicate neurons of ventral progenitor domain. M) A schematic diagram of various progenitor domains in dorso-ventral axis of spinal cord on the basis of spatial distribution and gene expression, adapted from Wilson and Maden [81]. ‘D’ and ‘V’ indicates dorsal and ventral side of the cord respectively. RP = Roof plate, FP = Floor plate, NC = Notochord, DP = Dorsal progenitor, VP = Ventral progenitor. Scale bar = 50 µm. |
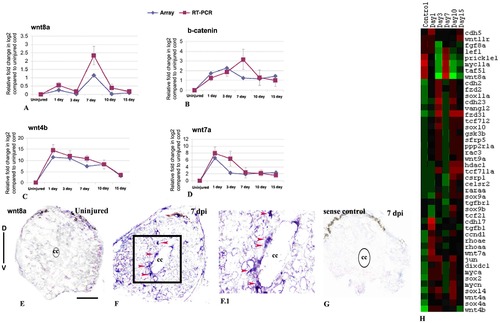
Differentially expressed genes involved in Wnt signaling pathway in zebrafish spinal cord after injury and validation of wnt8a, wnt4b, wnt7a and b-catenin: A–D) Quantitative RT-PCR analysis of wnt8a, b-catenin, wnt4b and wnt7a respectively showing fold change (red graph) and temporal expression pattern after injury. Pattern of expression was compared with microarray data (blue graph). Error bars represent SEM, n = 3, p<0.01. E–F) In situ hybridization with wnt8a anti-sense probe showed absence and presence of mRNA transcripts in uninjured and 7 dpi cord respectively. F.1) Higher magnification of the boxed area in section F shows wnt8a expression in ependymal cells (red arrowheads). G) In situ hybridization of 7 dpi section with wnt8asense probe as control. ‘D’ and ‘V’ indicates dorsal and ventral side of the cord respectively. The mark ‘cc’ denotes central canal of the cord. H) Represents temporal expression pattern of genes after SCI related to Wnt signaling pathway. The color chart indicates mean fold change of gene expression in each time points. Red and green colors represent increased and decreased expression respectively. Scale bar = 50 µm. |
|
ZFIN is incorporating published figure images and captions as part of an ongoing project. Figures from some publications have not yet been curated, or are not available for display because of copyright restrictions. |
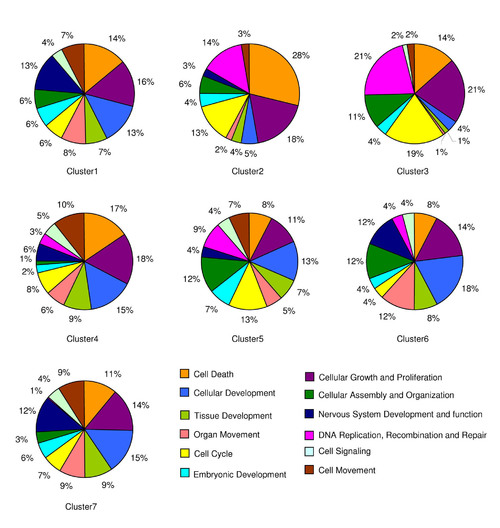
Pie charts showing the percentage of functionally enriched genes that are differentially expressed in the seven clusters. |
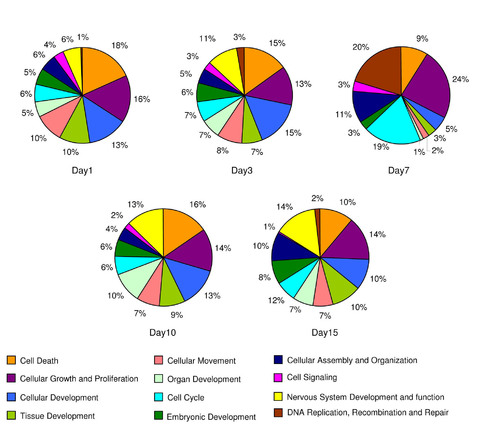
Pie charts show the percentage of functionally enriched genes that are differentially expressed at different time points after SCI in zebrafish. |
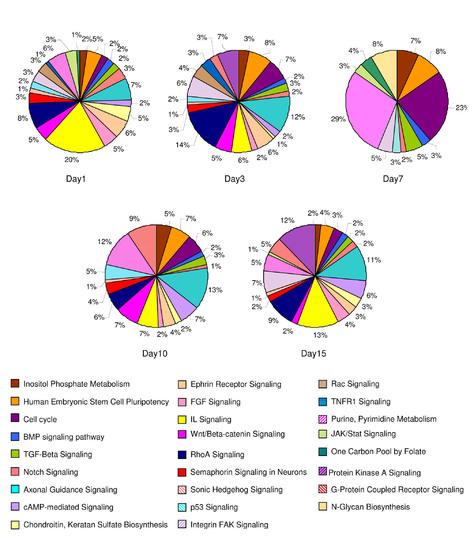
Pie charts showing the percentage of canonical pathway enriched genes that are differentially expressed at different time points after SCI in zebrafish. |
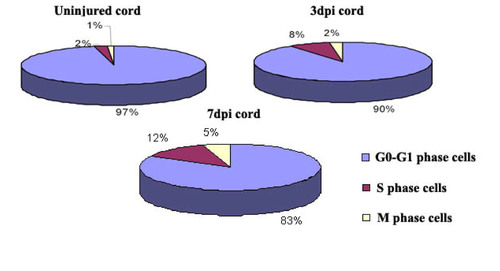
Quantification of cells present in different cell cycle phases in uninjured and injured cord based on BrdU, H3P and DAPI colocalization study. A) In uninjured cord only 2% and 1% of cells are in S-phase and M-phase respectively. B) In 3 dpi cord the percentage of S-phase cells have been increased significantly to 8% than uninjured cord and only 2% cells are in M-phase. C) In 7 dpi cord 12% of total populations are in S-phase and 5% of total populations are in M-phase. |
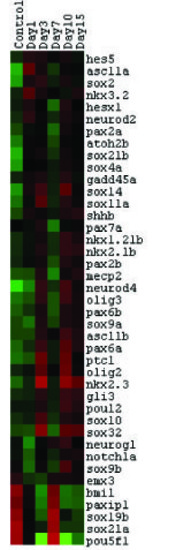
Dendrogram represents differential expression pattern of transcription factors involved in neurogenesis and neuronal specification during regeneration of zebrafish spinal cord. Each horizontal line indicates the expression pattern of each gene and the vertical columns indicate the uninjured control and time points after SCI. The color chart indicates mean fold change of gene expression in each time points. Red and green color represents increased and decreased expression respectively. |
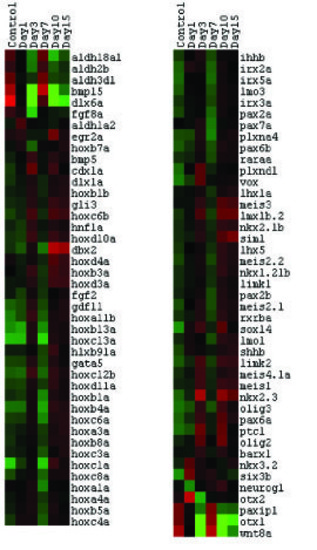
Differentially expressed genes related to pattern formation are represented in two dendograms in regenerating zebrafish spinal cord. Each horizontal line indicates the expression pattern of each gene and the vertical columns indicate the uninjured control and time points after SCI. The color chart indicates mean fold change of gene expression in each time points. Red and green colors represent increased and decreased expression respectively. |
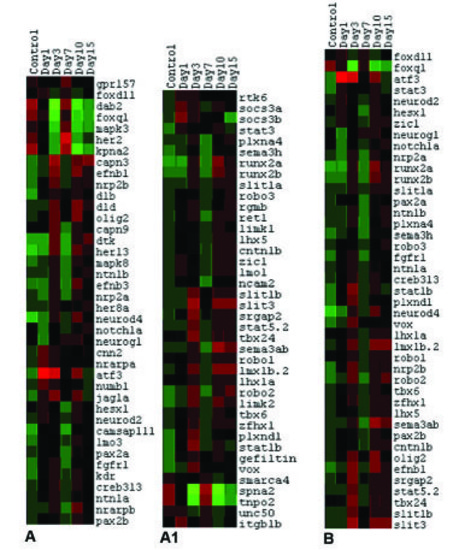
Differentially expressed genes related to axonogenesis and axonal guidance is represented in two different dendrograms (A and A1) in regenerating zebrafish spinal cord. Dendrogram (B) represents differential expression pattern of transcription factors involved in axonogenesis and axonal guidance. Each horizontal line indicates the expression pattern of each gene and the vertical columns indicate the uninjured control and time points after SCI. The color chart indicates mean fold change of gene expression in each time points. Red and green colors represent increased and decreased expression respectively. |
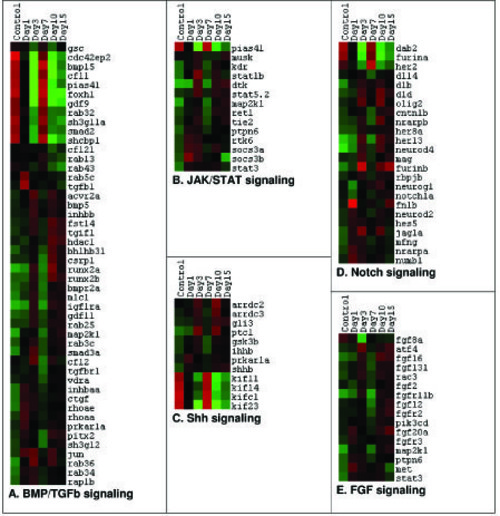
Differentially expressed genes involved in different signaling pathways in zebrafish spinal cord after injury. A–E) Dendrograms representing genes related to BMP/TGFβ signaling, JAK/STAT signaling, Shh signaling, Notch signaling and FGF signaling respectively. Each horizontal line indicates the expression pattern of each gene and the vertical columns indicate the uninjured control and time points after SCI. The color chart indicates mean fold change of gene expression in each time points. Red and green colors represent increased and decreased expression respectively. |
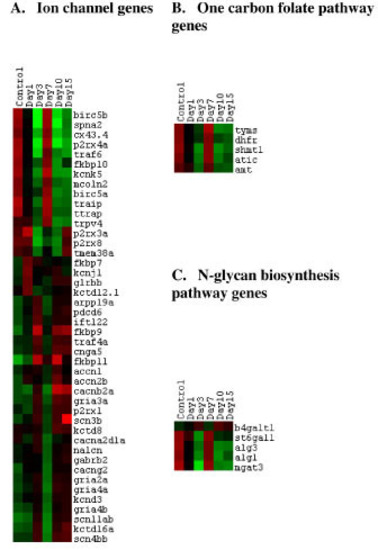
Differential expression pattern of genes involved in Ion channel transport, One carbon folate metabolism and N-glycan biosynthesis pathway during regeneration of zebrafish spinal cord. |
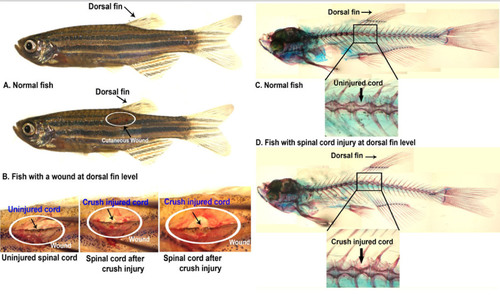
A) Adult zebrafish showing the dorsal fin level where a wound has been made. B) Inside wound showing uninjured spinal cord, spinal cord after giving control crush injury. C) Skeletal preparation of adult zebrafish stained with Alcian Blue and Alizarine Red, where vertebrae at dorsal fin level are clearly visible. D) Skeletal preparation of adult zebrafish after crush injury in spinal cord at dorsal fin level showing the injured vertebra. |