
- Title
-
Hoxb1b controls oriented cell division, cell shape and microtubule dynamics in neural tube morphogenesis
- Authors
- Zigman, M., Laumann-Lipp, N., Titus, T., Postlethwait, J., and Moens, C.B.
- Source
- Full text @ Development

Hoxb1b is required for hindbrain lumen morphogenesis. (A) Schematic of wild-type (Hoxb1b) and mutant (Hoxb1bb1219) protein domains of Danio rerio hoxb1b, with Antenapedia-type hexapeptide (AHP), DNA-binding homeobox domain and designated premature stop codon in Hoxb1bb1219 mutant protein. (B-C22) Abnormal anterior hindbrain lumen morphology at r3/4 in hoxb1b-/- compared with wild type at 22 hpf. (B) ZO-1 (apical tight junction) immunostaining; (C) Gt(Ctnna-Citrine)ct3a (adherens junctions; live embryos). C2-C22 are progressively deeper z-sections of the dorsal view in C; C2 is a sagittal reconstruction at r3/4. Note duplicated lumina in the dorsal hindbrain (red arrows). Colored arrowheads in C2 indicate planes of subsequent panels. White arrowheads and white arrows in B and C indicate neural tube lumen abnormalities. In B, lower panels are higher magnifications of boxed areas in upper panels. (D) Onset of r3/4 hindbrain morphology defects at 14, 16 and 23 hpf in hoxb1b-/- compared with wild-type hindbrain development. White arrows point to lumen discontinuities. Anterior-posterior axis marked by double arrows in all panels. EXPRESSION / LABELING:
PHENOTYPE:
|
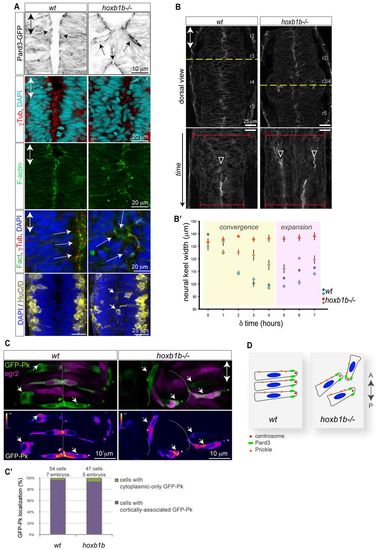
Normal cell polarity but disrupted convergence in the hoxb1b-/- neural keel. (A) Normal neuroepithelial polarity at the single-cell level in hoxb1b-/- based on sub-apical Pard3-GFP (black) at 21 hpf, apical centrosomes (γ-tubulin, red) and apically enriched F-actin (green), all analyzed at 19 hpf. Neuronal differentiation occurs at wild-type levels but generates HuC/D-positive neurons (yellow) in abnormal medial postitions in hoxb1b-/- at 20 hpf. (B) Dynamics of neural keel convergence in time-lapses of wild-type and hoxb1b-/- transgenic Gt(Ctnna-Citrine)ct3a embryos with multiphoton imaging. Upper panels show a single z-section in dorsal view one-third of the way through the time lapse, corresponding to about the 10-somite stage. Lower panels: kymograph of the position marked by a yellow dotted line, beginning at the 3-somite stage (11 hpf) and continuing until the 18 somite stage (18 hpf). A single lumen appears at the midline in wild type (arrowhead) whereas a duplicated midline appears at about the same stage in hoxb1b-/-. The width of the neural keel is depicted as red brackets. (B2) Quantification of neural keel width measured at three positions in r3/4 over the period in the kymograph. Convergence is significantly slowed in hoxb1b-/- compared with wild-type siblings (n=2 embryos for each genotype). Data are mean ± s.e.m. (C) Assessment of planar cell polarity by GFP-Prickle (green) localization at 18 hpf. Tg(egr2b:KalTA4) transgene (purple) is included to identify rhombomere 3. Mosaically expressed GFP-Pk localizes in puncta, which in wild type lie on anterior progenitor cell membranes (white arrows). In hoxb1b-/-, GFP-Pk localizes to puncta that lie on one side of mis-oriented progenitor cells. Lower panels show GFP-Pk signal presented in pseudocolors. (C2) Quantitative analysis of GFP-Prickle subcellular localization. (D) Schematic of cell polarity in hoxb1b-/-. The anterior-posterior animal axes are marked by double arrows in all panels. EXPRESSION / LABELING:
PHENOTYPE:
|

Hoxb1b regulates oriented cell division in the neural keel. (A) Tg(h2a.f/z-GFP) localizes to chromosomes that at anaphase reflect the orientation of cell division in the hindbrain (red arrows). (B) Quantification of mitosis orientation relative to the animal A/P axis (0°) in wild-type (n=153 cells, two embryos) and hoxb1b-/- (n=142 cells in r3/4 of hoxb1b-/- mutants with significantly abnormal mitosis orientation and n=41 cells in unaffected hoxb1b-/- r2 hindbrain region, three embryos for each). Imaging acquired at neural keel (12-15 hpf). (C) Representation of inferred spindle rotation relative to the A/P axis (0°) from time-lapse analysis of four wild-type and four hoxb1b-/- randomly chosen progenitors; additional tracks are shown in supplementary material Fig. S3A; the quantitation shown in D, D2 and E is based on n=15 single cell time lapses from each of three wild-type and three mutant embryos. Time interval is 21 seconds. (D) Relative difference between starting and ending inferred spindle orientation in wild-type and hoxb1b-/- mutant progenitors. (D2) Cumulative absolute spindle rotation (inferred from metaphase plate orientation) in wild type versus hoxb1b-/-. (E) Increased mitotic spindle rotation velocity (change in angle over time) in hoxb1b-/- compared with wild-type mitoses. (D-E) Graphs show the mean value with s.e.m. Hoxb1b is required for single-cell chromosome rotation independently of the prior interphase positioning. Quantitation of single cell behavior tracked over time when analyzed for the angle between the longest interphase nuclear axis prior to cell division and the axis of chromosome separation. (F) Rescue of abnormal lumen morphology by aphidicolin (Aph) and hydroxyurea (HU) incubation to block cell division in hoxb1b-/- (eight out of 11 hoxb1b-/- embryos) compared with control DMSO-treated hoxb1b-/- (seven out of eight hoxb1b-/- embryos). The lower panel shows the inhibition of proliferation caused by the drugs as verified by phosho-H3 staining. Double arrows mark the anterior-posterior axis. (G) Relative difference in the orientation (angle, degrees) between interphase and anaphase measured in individual wild-type and hoxb1b-/- cells, as schematized on the right. EXPRESSION / LABELING:
PHENOTYPE:
|
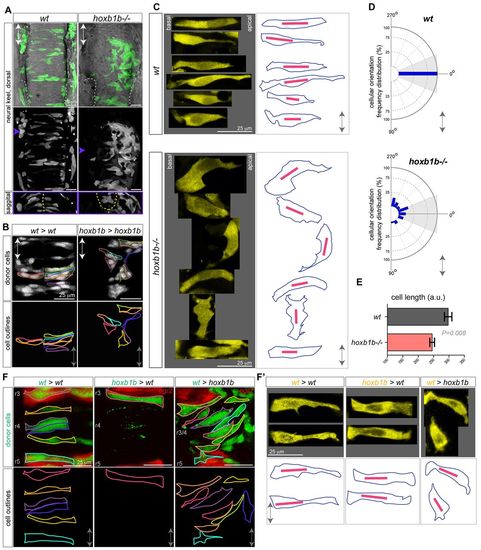
Hoxb1b-dependent cell shape changes. (A) Mosaic unilateral labeling (green) of wild-type and hoxb1b-/- embryos results in a bilateral cell distribution in wild-type but unilateral, abnormal cell distribution in hoxb1b-/- embryos. Top and middle panels, dorsal view; bottom panels, sagittal optical section at the level of r3/4 at <16 hpf. White dashed lines outline otic vesicles; yellow dashed lines indicate midline. (B) Unilaterally transplanted wild-type and hoxb1b-/- donor cells in wild-type and hoxb1b-/- hosts, respectively. Single cells are outlined and are bilaterally distributed in wild type but unilateral and disorganized in hoxb1b-/- r3/4 at <17 hpf. (C) Cell shape as visualized in maximal intensity projections of single cells from r3, r4 of wild-type and hoxb1b-/- embryos at 15-17 hpf (n=3 embryos per genotype). Projections from single cells were isolated and arranged as originally embedded within the animal axis, with basal to left and more apical side to the right. Right panels: outlines of corresponding single cells (blue) from the left, with the longest diagonal of each cell presented (red line). Note elongated wild-type cells and broader, misoriented hoxb1b-/- cells. (D) Cellular orientation (based on the longest diagonal of each cell) relative to the A/P embryo axis of wild-type and hoxb1b-/- cells. The A/P axis is vertical with anterior at 0°. Note strong bias towards orientation perpendicular to the A/P in wild-type cells compared with significantly abnormal orientation of hoxb1b-/- cells. (E) Length of individual cell longest diagonal in wild-type and hoxb1b-/- r3/4 territory presented as mean ± s.e.m. Note that wild-type cells are significantly longer compared with hoxb1b-/-. (F) Cell shape of individual neuroepithelial progenitors (green) in genetic mosaics expressing egr2 transgenic reporter (red) visualizing r3 and r5 at 17 hpf. (F2) Zoomed in maximal intensity projections of single cells (yellow) from r3, r4 of transplanted cells at 15-17 hpf (n=3 embryos for all genotypes). Projections from single cells were isolated and arranged as noted for C Lower panels: outlines of corresponding single cells (blue) with the longest diagonal of each cell presented (red line). Anterior-posterior axis marked by double arrow in all panels. |
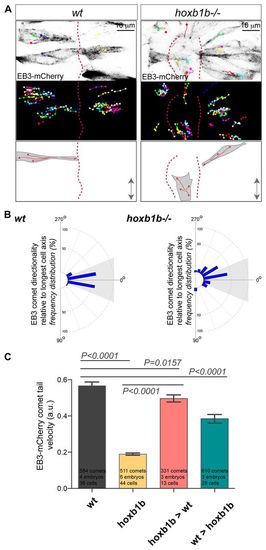
Hoxb1b is essential for plus end microtubule dynamics. (A) Live imaging of neuroepithelial cells of EB3-mCherry mRNA-injected wild type and hoxb1b-/- at r3/r4 with single EB3-mCherry comets marked as colored dots (presenting last position) connected with lines (movement over time) between 15 and 17 hpf. Top panels show a single time point, middle panels show tracks of individual EB3-mCherry comets projected over time revealing the effect on Hoxb1b loss on the comet directionality. MT plus-end dynamics are schematized at the bottom. Double arrows indicate the embryo anterior-posterior axis. Red dashed lines indicate midline. (B) Quantitation of single EB3-mCherry comets when tracked over time in respect to the A/P axis (0°) demonstrating quantitative defects in MT growth in hoxb1b-/- (n=6 embryos) compared with wild-type controls (n=4 embryos). (C) Decreased velocity of individual EB3-mCherry comets in hoxb1b-/- compared with wild type. Note rescue of EB3-mCherry comet dynamics in hoxb1b-/- cells when transplanted into wild-type hosts and partial (but significant) decrease in comet velocity in wild-type cells when transplanted into hoxb1b-/- embryos. Results presented as mean ± s.e.m. The data used for quantification of wild type and hoxb1b-/- in B and C originate from the same data set. |

Hindbrain rhombomere identity and boundary formation is disrupted in hoxb1b/ mutant embryos. (A) In situ hybridization of hoxa2 in wild-type and hoxb1b/ embryos at 22hpf. Note lack of hoxa2 signal in second branchial arch neural crest domains (arrows). Otic vesicles are circled. (B) In situ hybridization of dlx2a and egr2 in wild-type and hoxb1b/ at 22hpf with less organized and fused neural crest streams (arrows) in the first (I) and the second (II) arch. (C) Alcian green preparations of branchial jaw cartilages from wild-type and mutant larvae showing single elements: M=Meckel’s, PQ=palatoquadrate, CH=ceratohyal, HS=hyosymplectic. Note fusion of first pharyngeal arch Meckel’s cartilage and 2nd pharyngeal arch ceratohyal cartilage (arrow). (D) Rhombomere boundary marker sema3gb reveals that anterior hindbrain boundaries between r2 and r5 are lost in hoxb1b/ embryos. (E) Onset of egr2 in r3, r5 of Tg(egr2b:KalTA4) live embryos. Start (0h) at about 5 somites. Fluorescence intensity in pseudocolors. Note single egr2-positive cells out of register (arrows) in hoxb1b/. (F) Reticulospinal neurons in larval hindbrain demonstrating requirement of Hoxb1b for rhombomere 4-specific Mauthner neurons (asteriks) in r4. (G) Requirement of Hoxb1b in single cells to contribute to anterior r3, r4 hindbrain segments in chimeric embryos. Donor cells from wild-type and hoxb1b/;Tg(h2a.f/z-GFP) donor fluorescent dextran injected embryos (green) transplanted into wild-type Tg(egr2b:KalTA4) which expresses mCherry in r3 and r5 (purple). Note sorting out of hoxb1b/ r3, r4 and r5. (H) Anterior lumen morphology at 23hpf upon injection of 750pg hoxb1b mRNA per embryo into wild-type (hoxb1b+/+ and hoxb1b+/) (n=62) and hoxb1b/)(n=21) embryos when compared to control wildtype (n=65) and hoxb1b/ (n=13) embryos. Anterior-posterior axis marked by double arrows in all panels. |
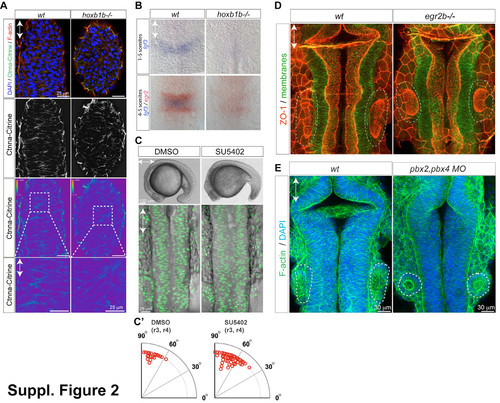
Hindbrain morphogenesis defects in hoxb1b/ mutants is not due to reduced cell-cell adhesion, lack of FGF signaling, or lack of rhombomere boundaries. (A) Ctnna-Citrine (green), F-actin (red) and DNA (blue) in the dorsal neural keel r3/4 level at 15 hpf demonstrating normal levels and distribution of Ctnna in hoxb1b/. Lower panels: Ctnna-Citrine channel shown in pseudocolours. Levels in wild-type and mutant are normalized to the level in the enveloping layer visible in the periphery of the z-section, which is not expected to be affected by hoxb1b loss. (B) Decreased expression of fgf3 mRNA expression (blue) in hoxb1b/ compared to control siblings. (C) Live embyos incubated in SU5402 (100 microM) from the 1 somite stage onward have defective tail outgrowth (top panels) but no defect in hindbrain morphogenesis (lower panels, Tg(h2a.f/z-GFP) marks nuclei). (C2) Blocking FGF signaling does not disrupt the predominantly apico-basal orientation of cell division in the neural keel, quantitated as in Fig. 3. (D) Normal hindbrain lumen morphogenesis in 22 hpf egr2/ embryos based on ZO-1 staining (neuroepithelial apical surface). (E) Normal hindbrain morphology in pbx2;pbx4 double morphants based on phalloidin staining (F-actin) at 21 hpf. Anterior-posterior axis is indicated by double arrows; otic vesicles at the level of r5 are circled by a dashed line. |
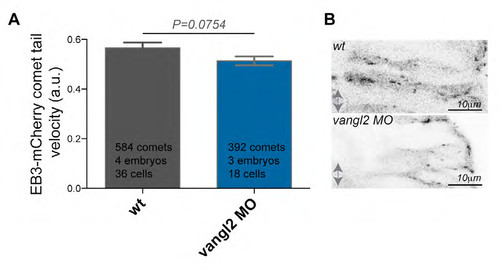
Vangl2 loss of function does not impact on plus end MT dynamics. (A) Velocity of EB3-mCherry comets over time in vangl2 MO injected embryos is not significantly changed when compared to wild-type controls in neural keel hindbrain neuroepithelial cells at 15-17hpf. The data used for quantification of wild-type originates from the same data set as used for the Fig. 5C. (B) Representative pictures of vangl2 MO injected embryos and wild-type controls injected with EB3-mCherry. Anterior posterior axis is indicated by double arrow, apical is to left, basal to the right. |