
- Title
-
Impact of a combined high cholesterol diet and high glucose environment on vasculature
- Authors
- Wang, Z., Mao, Y., Cui, T., Tang, D., and Wang, X.L.
- Source
- Full text @ PLoS One

ZFIN is incorporating published figure images and captions as part of an ongoing project. Figures from some publications have not yet been curated, or are not available for display because of copyright restrictions. EXPRESSION / LABELING:
PHENOTYPE:
|
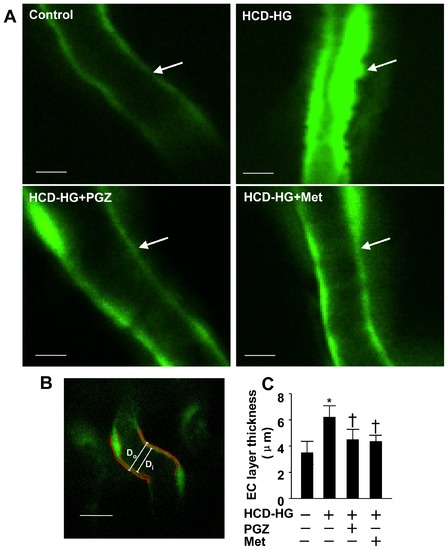
Endothelial layer thickening of optical vessels in HCD-HG treatment group. A: Different treatments led to changes of endothelial layer in optical arteries. Transgenic zebrafish (Fli1:EGFP) larvae were imaged in a lateral position by confocal microscope, and emission wavelength of 488 nm was detected. Scale bar = 10 μm. B: Endothelial layer thickness (T) was measured by subtracting inner diameter (Di) from outer diameter (Do), T = (Do-Di)/2. Changes in the thickness of endothelial layer were quantified and presented as mean ±SD. Scale bar = 20 μm. C: Pioglitazone and metformin effectively prevented the endothelial layer from becoming thick afer HCD-HG treatment. N = 11 in the control group, N = 24 in the HCD-HG group, N = 10 in HCD-HG+ pioglitazone group, N = 18 in HCD-HG+ metformin group. PGZ: pioglitazone; Met: metformin. Asterisk (*): Comparison of EC layer thickness between control group and HCD-HG group (p<0.05). Cross (†): Comparison of EC layer thickness between control and drugs treatment groups (p<0.05). EXPRESSION / LABELING:
PHENOTYPE:
|
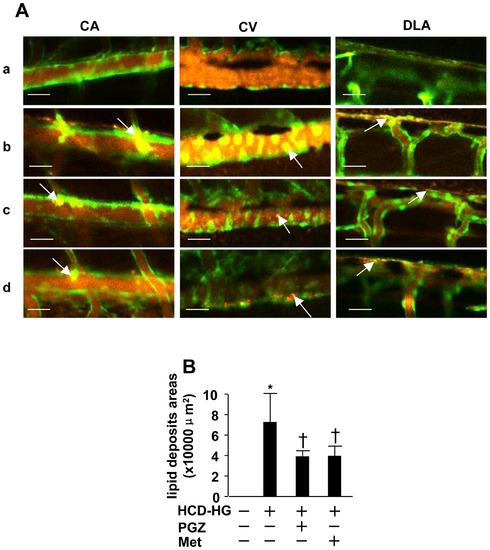
Lipid accumulation in vasculature. A: Apparent lipid accumulation (yellow) was observed. (a), (b), (c), (d) panels respectively show lipid deposits in different experimental groups. (a) Control group; (b) HCD-HG group; (c) Pioglitazone treatment group; (d) Metformin treatment group. White arrows point out the locations of lipid deposits. Scale bar = 40 μm. B: Areas of the lipid accumulation were selected as the region of interest (ROI), and estimated by measuring the dimension of ROI. Using the Student t test, we found that the amount of lipid accumulation was significantly larger in the HCD-HG treated group than that in the control group (p<0.05). The addition of pioglitazone or metformin significantly reduced the lipid accumulation (p<0.05). Asterisk (*): Comparison of lipid accumulation between control group and HCD-HG group. Cross (†): Comparison of lipid accumulation between HCD-HG group and drug treatment groups, respectively. |
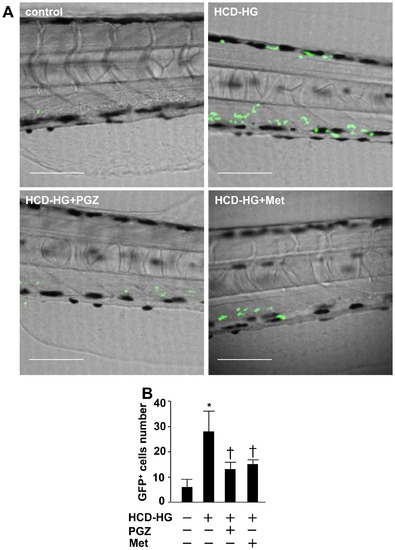
HCD-HG treatment induced inflammatory cells infiltration. A: HCD-HG treatment resulted in the increased number of GFP+ cells around the caudal vein. B: GFP+ cells that locate within 50 μm from the lumen of the caudal artery were counted. n>5 in each group and the experiment was repeated for three times. The results were compared between normal and HCD-HG treated group, HCD-HG treated group and HCD-HG+ pioglitazone or metformin group respectively compared between the four groups by Student t test, p<0.05. Scale bar = 80 μm. Asterisk (*): Comparison of the number of GFP+ cells between control group and HCD-HG group. Cross(†): Comparison of the number of GFP+ cells between HCD-HG group and drug treatment groups, respectively. EXPRESSION / LABELING:
PHENOTYPE:
|
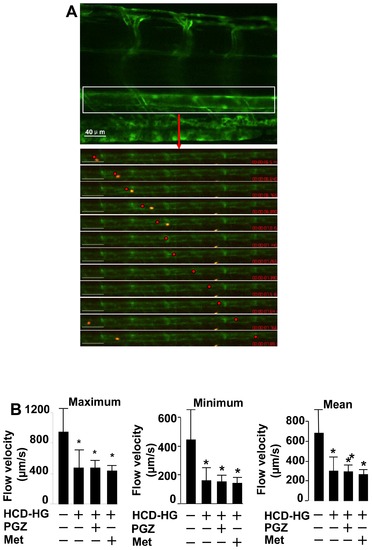
HCD-HG treatment led to reduced velocity of blood flow. A: Velocity of the blood flow in the caudal aorta (CA) was measured. An example of the red blood cell tracking was present in the CA. Each cell was tracked for more than 10 time points, and corresponding frames were produced; motion trajectory was estimated. Relative time and distance were used for the calculation of the velocity. Upper panel scale bar:40 μm; the beneath panel scale bar: 80 μm. B: The values of maximum, minimum, and mean velocities were compared between normal and HCD-HG treated group, HCD-HG treated group and HCD-HG+ pioglitazone or metformin group respectively by Student′s t test (n>5 in each group). Asterisk (*): Comparison of flow velocity between control group and corresponding groups, p<0.05. EXPRESSION / LABELING:
PHENOTYPE:
|