
- Title
-
Calcium deficiency-induced and TRP channel-regulated IGF1R-PI3K-Akt signaling regulates abnormal epithelial cell proliferation
- Authors
- Dai, W., Bai, Y., Hebda, L., Zhong, X., Liu, J., Kao, J., and Duan, C.
- Source
- Full text @ Cell Death Differ.
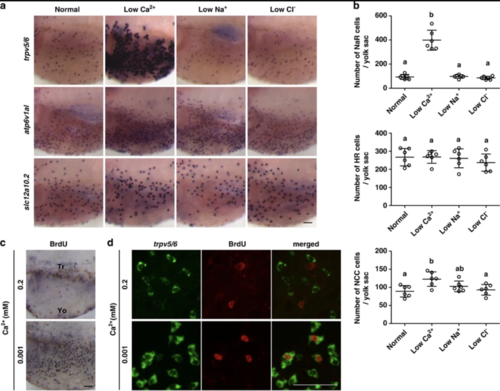
Low [Ca2+] treatment increases NaR cell number and density on the larval yolk sac by reactivating a mitotic program in pre-existing NaR cells. (a and b) Low [Ca2+] treatment increases NaR cell density and number on the larval yolk sac skin. Zebrafish larvae (72hpf) were transferred to artificial freshwater containing low [Ca2+], low [Na+], or low [Cl], raised to 120 hpf, and analyzed by in situ hybridization for the indicated genes. Representative views are shown in (a). Shown here and in all following figures are lateral views of the yolk sac region. Anterior to the left and dorsal up. Scale bar=50 μm. The total number of ionocytes on one side of the yolk sac was manually counted and shown in (b). Each dot represents an individual fish. Mean±S.D., n=6. Groups labeled with different letters are significantly different from each other (P<0.05). (c) Low [Ca2+] treatment increases cell proliferation. Larvae (72 hpf) were transferred to artificial freshwater with the indicated [Ca2+]. BrdU (10 mM) was added at 96 hpf. The larvae were raised to 120 hpf and stained using a BrdU antibody. Tr, trunk; Yo, yolk sac. (d) The mitotic cells under low [Ca2+] are NaR cells. 72 hpf larvae were transferred to artificial freshwater with the indicated [Ca2+] and raised to 120 hpf. BrdU (10 mM) was added 30 min before sampling. The larvae were analyzed by trpv5/6 mRNA in situ hybridization (green) and BrdU staining (red) |
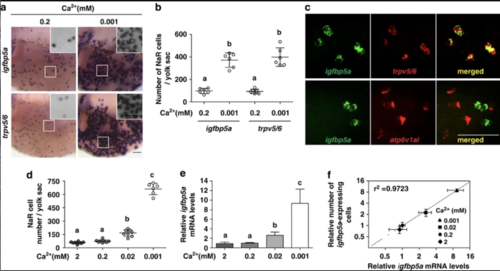
Zebrafish igfbp5a mRNA is specifically expressed in NaR cells and its levels are correlated with NaR cell number. (a and b) Low [Ca2+] treatment results in similar increases in the number of igfbp5a mRNA-expressing cells and trpv5/6 mRNA-expressing cells. Zebrafish larvae (72 hpf) were transferred to artificial freshwater with the indicated [Ca2+], raised to 120 hpf, and analyzed by in situ hybridization for the indicated genes. Representative views are shown in (a). Inserts are higher magnification views. The number of igfbp5a mRNA- and trpv5/6 mRNA-labeled cells on the yolk sac was manually counted and shown in (b). Each dot represents an individual fish. Mean±S.D., n=6. Groups labeled with different letters are significantly different from each other (P<0.05). (c) Double-label in situ hybridization analysis of igfbp5a mRNA and trpv5/6 mRNA in zebrafish larvae. Upper panel shows a representative result. Lower panel is a representative result of igfbp5a mRNA (green) and atp6v1al mRNA (red). (d) Relationship between NaR cell number and [Ca2+]. Zebrafish embryos were raised in artificial freshwater with the indicated varying [Ca2+]. NaR cells were analyzed by in situ hybridization of igfbp5a mRNA, and their number counted manually. Data shown are mean±S.D., n=6–8. (e) Relationship between igfbp5a mRNA levels and [Ca2+]. Total RNA was isolated from 120 hpf larvae raised as in (d). The igfbp5a mRNA levels were measured by qRT-PCR and normalized by the β-actin levels. Mean±S.D., n=3. (f) Correlation analysis of NaR cell number and igfbp5a mRNA levels |

Low [Ca2+] treatment results in a rapid and sustained activation of IGF-PI3K-Akt in NaR cells. (a) Low [Ca2+] treatment induces the activation of phospho-Akt (pAkt) in yolk sac cells. Larvae (72 hpf) were transferred to artificial freshwater with the indicated [Ca2+], raised to 120 hpf, and stained for pAkt. Inserts are higher magnification views. Tr, trunk; Pe, pectoral fin; Yo, yolk sac. Scale bar=50 μm. (b) All pAkt-positive cells are NaR cells. Larvae (72 hpf) were transferred to artificial freshwater containing 0.001 mM [Ca2+]. After 48 h, they were analyzed by in situ hybridization for igfbp5a mRNA and pAkt immunostaining. (c) Time course effect. Larvae (72 hpf) were transferred to artificial freshwater containing 0.001 mM [Ca2+], sampled at the time points indicated, and stained for pAkt. Inserts are higher magnification views. (d and e) The low [Ca2+]-induced pAkt activation is IGF1R- and PI3K-dependent. Larvae (72 hpf) were transferred to 0.001 mM [Ca2+] water containing DMSO, BMS-754807 (BMS, 0.3 μM), NVP-AEW541 (NVP, 6 μM), wortmannin (Wort, 0.06 μM), LY294002 (LY, 5 μM), SU5402 (SU, 15 μM), or AG1478 (AG, 4 μM). After 8 h, they were stained for pAkt. Representative views are shown in (d). The animals were scored according to the scoring system shown in Supplementary Figure S1a and the quantitative results from three independent experiments are shown in (e). The total number of fish analyzed is shown on the top of each column. (f) Effect of EGTA on pAkt. 72 hpf larvae were transferred to 0.2 mM [Ca2+] water containing the indicated concentrations of EGTA. After 8 h, they were stained for pAkt. The quantitative results are shown. Fish larvae raised in 0.001 mM [Ca2+] water were used as controls |

Local Igfbp5a facilitates [Ca2+]-induced IGF signaling activation and IGF signaling is required for low [Ca2+]-induced NaR cell proliferation. (a and b) Igfbp5a knockdown inhibits low [Ca2+]-induced Akt signaling. Embryos injected with control MO or Igfbp5a targeting MOs were transferred to water with the indicated [Ca2+] at 72 hpf and fixed 2 h later for pAkt staining. Representative views are shown in (a) and quantitative results in (b). Scale bar=50 μm. The total number of fish analyzed from three independent experiments is shown on the top of each column. (c) Zebrafish igfbp5a encodes a secreted protein that binds IGFs. Conditioned media were prepared from HEK293 cells transfected with expression plasmids encoding the indicated proteins. They were analyzed by ligand blot with DIG-labeled IGF-1 or IGF-2, and by western blot using the indicated antibody. LBD, ligand binding domain mutant. (d and e) Inhibition of IGF1R abolishes low [Ca2+]-induced increase in NaR cells. Larvae (72 hpf) were transferred to 0.2 mM or 0.001 mM [Ca2+] water containing DMSO, BMS-754807 (BMS, 0.3 μM), or NVP-AEW541 (NVP, 2 μM), and raised to 120 hpf. NaR cells were labeled by in situ hybridization for igfbp5a mRNA. Representative views are shown in (d). The animals were scored according to the scoring system shown in Supplementary Figure S1c and the results are shown in (e). (f) Effect of IGF1R inhibition on igfbp5a mRNA levels. The experimental groups were the same as described in (d). The mRNA levels of igfbp5a were measured by qRT-PCR and normalized by the β-actin levels. Values shown are mean±S.D., n=3. *P<0.001 compared with the corresponding 0.2 mM [Ca2+] control group. (g) Effects of PI3K, Akt, and MEK inhibitors. Larvae (72 hpf) were transferred to 0.2 mM or 0.001 mM [Ca2+] water containing DMSO, Wortmannin (0.06 μM), LY294002 (5 μM), U0126 (U, 10 μM), PD98059 (PD, 10 μM), Akti-1/2 (Akti, 5 μM), or MK2206 (MK, 2 μM), and raised to 120 hpf. NaR cell density was determined as described in (e). (h) Effects of blocking PI3K, Akt, and MEK on igfbp5a mRNA levels. The experimental groups were the same as described in (g). The igfbp5a mRNA levels were measured by qRT-PCR and normalized by the β-actin levels. Mean±S.D., n=3. *P<0.001 compared to the corresponding 0.2 mM [Ca2+] control group |

Loss of Trpv5/6 results in IGF-PI3K-Akt activation and increased NaR cell proliferation under normal [Ca2+]. (a and b) Elevated NaR cell number and density in the mus (loss-of-function trpv5/6) mutant larvae under normal [Ca2+]. Homozygous mus embryos and their siblings were raised in 0.2 mM [Ca2+] water. DMSO or 0.3 μM BMS-754807 was added at 24 hpf. At 120 hpf, fish were fixed and NaR cells were labeled by in situ hybridization for igfbp5a mRNA. Representative views are shown in (a) and quantitative results from three independent experiments in (b). (c and d) Elevated Akt signaling in the mus mutant larvae. The experimental groups were the same as described in (a). pAkt-positive cells were labeled and scored according to Supplementary Figure S1d. Representative views are shown in (c) and quantitative results are shown in (d). (e) Elevated NaR cell proliferation in the mus mutant fish. Homozygous mus embryos and their siblings were raised in 0.2 mM [Ca2+] water. At 120 hpf, they were fixed and analyzed by in situ hybridization for igfbp5a mRNA and BrdU staining after a 30 min pulse of BrdU (10 mM) prior to the sampling. (f and g) Knockdown of Trpv5/6 results in increased pAkt-positive cells (f) and igfbp5a mRNA-expressing NaR cells (g). Embryos injected with control or Trpv5/6 targeting MOs were raised in 0.2 mM [Ca2+] water. pAkt-positive cells (f) and NaR cells (g) were labeled and scored at 72 and 120 hpf as described above |

A proposed model on how Trpv5/6 regulates IGF signaling and epithelial growth under normal and Ca2+-deficient conditions. Upper panel: under normal [Ca2+], the activity of IGF1R-PI3K-Akt signaling in NaR cells is under the negative regulation of Trpv5/6 and cell proliferation is kept at low levels. As a result, there are a limited number of NaR cells on the larval yolk sac skin. Lower panel: under low [Ca2+] environments, the number and density of NaR cells increase dramatically due to elevated proliferation of pre-existing NaR cells. Low [Ca2+] results in changes in Trpv5/6 activity (1). This leads to membrane depolarization (2), which in turn leads to the amplification of IGF signaling at the levels of PI3K and Akt (3). Local Igfbp5a facilitates the IGF ligand and receptor binding (4). The activation of IGF1R-PI3K-Akt signaling stimulates NaR cells to re-enter the cell cycle (5), leading to the increased NaR cell number and density |
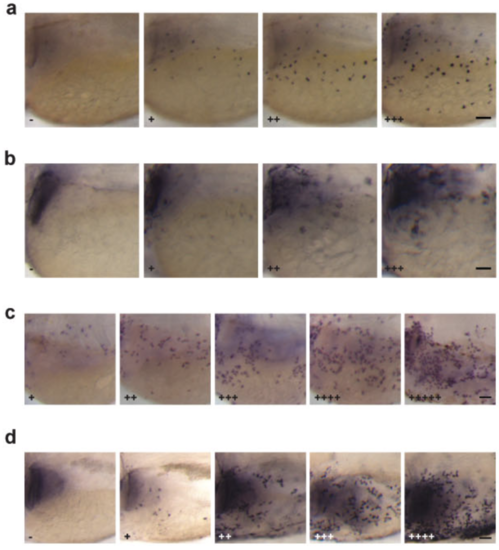
The scoring system used in this study. (a) Four different levels of pAkt signal were observed in 80 hpf zebrafish larvae and used for quantification. (b) Four different levels of pErk signal were observed in 80 hpf zebrafish larvae and used for quantification. (c) Five different levels of NaR cell density were observed in 120 hpf larval skin analyzed by in situ hybridization for igfbp5a mRNA and used for quantification in this study. (d) Five different levels of pAkt signal observed in 120 hpf larvae and used for quantification. All images shown are lateral views of the yolk sac region with anterior to the left and dorsal up. Scale bar =50 μm. |
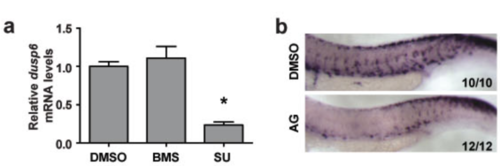
SU5402 and AG1478 effectively blocks FGFR and EGFR signaling in zebrafish. (a) 24 hpf embryos were treated with water containing DMSO, 0.3 μM BMS-754807 (BMS), or 15 μM SU5402 (SU). After 8 h, the levels of dusp6 mRNA were measured by qRT-PCR and normalized using β-actin mRNA levels. Values shown are mean ± SD, n=3. * P < 0.001 compared to the DMSO group. (b) Embryos were treated with water containing DMSO or 4 μM AG1478 (AG) from 13 to 30 hpf, and subjected to in situ hybridization for crestin. The frequency of embryos with the indicated expression patterns is shown in the bottom right of each panel. |

Low [Ca2+] treatment or IGF1R inhibition has no effect on pErk signaling in larval zebrafish. (a) Lack of effect of low [Ca2+] treatment on pErk levels. 72 hpf zebrafish larvae were transferred to artificial water with the indicated [Ca2+], raised to 120 hpf, fixed and stained for pErk. Inserts are higher magnification views. Tr, trunk; Pe, pectoral fin; Yo, yolk sac. Scale bar = 50 μm. (b and c) The pErk signal is independent of IGF1R. 72 hpf larvae were transferred to the 0.001 mM [Ca2+] water containing DMSO, BMS-754807 (0.6 μM), NVP-AEW541 (6 μM), U0126 (10 μM), or PD98059 (10 μM). After 8 h, they were stained for pErk. Representative views are shown in (b) and quantitative results are shown in (c). The animals were scored according to the scoring system shown in Fig. S1b. The number of fish analyzed is shown on the top of each column. |

Effectiveness and specificity of igfbp5a MOs used. The Igfbp5a-GFP or Igfbp5b-GFP reporter plasmid was injected into 1~2 cell stage embryos alone or together with Igfbp5a targeting MO1+MO2 (TB) or the standard control MO (CT). Non-injected embryos (WT) were used as negative controls. Fluorescent microscopy images of 25 hpf embryos are shown. Scale bar = 1 mm. |