
- Title
-
An Anti-inflammatory NOD-like Receptor Is Required for Microglia Development
- Authors
- Shiau, C.E., Monk, K.R., Joo, W., and Talbot, W.S.
- Source
- Full text @ Cell Rep.
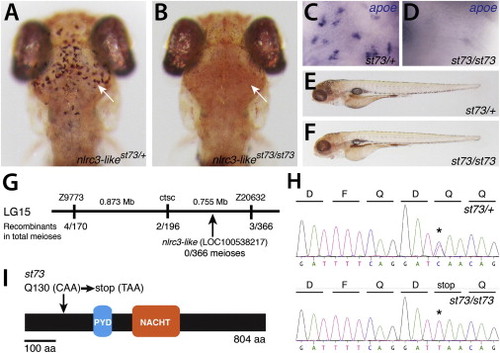
Lack of Microglia in nlrc3-like Mutants (A and B) Live 5 dpf zebrafish larvae were stained by neutral red to visualize microglia in the brain. (A) Heterozygous st73/+ larva (arrow points to microglia around optic tectum) is shown. (B) Homozygous st73 larvae have no microglia (arrow). Dorsal views; anterior is to the top. (C and D) Microglial marker apoe expression at 5 dpf in the brain is shown. (E and F) Neutral red-stained heterozygous (E) and homozygous mutant (F) shows normal whole-animal morphologies at 5 dpf. Lateral views; anterior is to the left. (G) Genetic and physical map of the st73 locus. (H) Sequence chromatogram shows the lesion (asterisks) in the coding sequence of nlrc3-like (LOC100538217). (I) The st73 mutation introduces a premature stop codon near the 52 end of the open reading frame of nlrc3-like. See also Figure S1. |
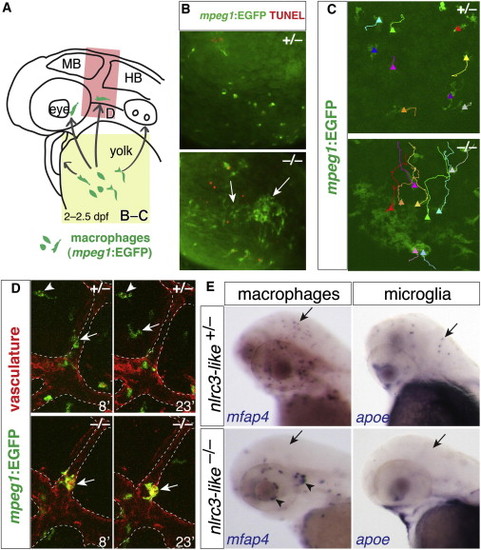
Aberrant Migration of Primitive Macrophages in nlrc3-like/ Mutants (A) Diagram shows the stereotypical migration route of macrophages from yolk sac to embryo proper (arrows). (B) Fluorescent images show abnormal active coalescence of yolk sac macrophages (mpeg1:EGFP+ in green, arrows) that overlap with apoptotic marker TUNEL in red in mutants (bottom panel; n = 12/12), which does not occur in wild-type (top panel; n = 11/11). Region of imaging is indicated by yellow box in (A). (C) Trajectories of individual yolk sac macrophages are shown using the MTrackJ cell-tracking tool, where the end point is indicated by a solid-triangle marker. See Movies S1 and S2 for the time-lapse series. (D) Time-lapse imaging shows the head region (red box in A) where macrophages are expected to migrate into the brain, using transient transgenesis of the mpeg1:EGFP construct labeling macrophages in green and the stable transgene kdrl:mCherry-CAAX to visualize the vasculature in red. Imaging shows macrophages entering the brain in wild-type siblings (top) but not mutant (bottom). The numbers indicate the time in minutes. In the top panels, the arrowhead points to a macrophage that has taken up residence in the brain to become a microglial cell; the arrow points to another macrophage migrating into the brain. In the bottom panels, the arrow points to a mutant macrophage that does not enter the brain and remains associated with vasculature (as demarcated by dotted lines). See Movies S3 and S4. (E) Whole-mount in situ hybridization at 2.5 dpf shows macrophage mfap4+ and microglial apoe+ cells in wild-type heterozygous embryos (arrows), but not in mutants (arrows). Aberrant macrophage clusters form near cranial vasculature in mutants (arrowheads). MB, midbrain; HB, hindbrain. |
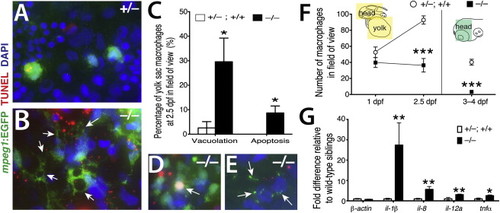
Inappropriate Inflammatory Activation of Macrophages in nlrc3-like/ Mutants (A and B) High-magnification images show striking cell morphology differences between yolk sac macrophages of wild-type (A) and mutant (B). Macrophages in the mutants have multiple, large vacuoles (arrows). (C) Plot shows significantly higher percentages of primitive macrophages (mpeg1-EGFP+) exhibiting vacuolation (one or more large cytoplasmic vacuoles; p = 0.047) and cell death (overlap of TUNEL staining with macrophage DAPI staining; p = 0.037) in nlrc3-like/ mutants (n = 5 embryos) compared with siblings (n = 6 embryos). Statistical significance was determined by the two-tailed Student’s t test. (D and E) Examples of dying mutant macrophages exhibiting apoptosis (arrow in D), and cellular breakdown (arrows in E) are shown. (F) Plot shows macrophage number over time. Diagram indicates the region of quantification (colored boxes): n = 5 for each genotype at 1 and 2.5 dpf, p = 0.0009 at 2.5 dpf; at 3–4 dpf, n = 7 siblings and n = 3 mutants (p = 2 × 10⁵). (G) Graph shows relative mRNA levels of proinflammatory cytokines by qPCR comparing mutants (n = 6) to wild-type siblings (n = 6) at 3 dpf. p = 0.70 (β-actin), p = 0.002 (il-1β), p = 0.004 (il-8), p = 0.008 (il-12a), and p = 0.03 (tnfα). n, number of independent embryos analyzed. Error bars show SEM. p < 0.05, p < 0.01, and p < 0.001. All p values are two tailed. EXPRESSION / LABELING:
PHENOTYPE:
|

Systemic Inflammation in nlrc3-like/ Mutants in the Absence of Infection or Injury (A and B) Neutrophil-specific marker mpo shows no brain neutrophils in wild-type siblings (arrow, A) but abundant infiltration in mutants (arrow, B). Lateral views, anterior to the left. (C and D) Representative frames from time-lapse imaging in the intact 2.5 dpf embryos (see Movies S5 and S6) show wandering neutrophils (lyz:EGFP) in the brain of mutants (D) but none in wild-type (C), with reference to vasculature (kdrl:mCherry-CAAX). Dorsal views, anterior to the top. (E and F) Higher magnification shows GFP channel alone (dotted-box region in C and D, respectively). (G) Plot shows that high numbers of neutrophils infiltrate the brain in mutants (n = 15) but nearly zero in wild-type (n = 16; p = 0.0018). (H and I) Representative images show live imaging of neutrophils at 1.5 dpf in wild-type sibling (H) and in mutant (I). (I) Mutant embryos show large numbers of neutrophils in brain (asterisk) and circulation (arrows). Lateral views, anterior to the top. ey, eye; mb, midbrain; ot, otic vesicle. (J) Plot shows significantly higher numbers of circulating neutrophils in mutants (n = 4) compared with wild-type (n = 5; p = 0.0083). (K) Neutrophils (lyz:EGFP as pseudocolored in red) are closely intermixed with the aberrantly coalescing macrophages (L-plastin expression only as shown in green) in the mutants, whereas wild-type neutrophils are dispersed and not clustered with macrophages. n, number of embryos analyzed. Error bars show SEM. p < 0.01. All p values are two tailed. |

nlrc3-like Has an Autonomous and Continuous Function in Macrophages that Become Microglia (A) Top view is a diagram of transgenic constructs driving either control mCherry or nlrc3-like expression by tissue-specific gene promoters in skin (keratin 4/krt4), neurons (elavl3/huC), neutrophils (lyz), or macrophages (mpeg1). Bottom view is representative images showing rescue of neutral red-positive microglia in nlrc3-like/ mutants when expression of wild-type nlrc3-like is restored in macrophages (right), but not by control mCherry expression (left). (B) Plot quantifies the percentage of microglia rescue using different tissue-specific expression vectors. Ctrl, control mCherry injected; NLR, nlrc3-like construct injected. (C) Images and plot show microglia by neutral red staining at 6 dpf, after nlrc3-like mRNA injection at the one-cell stage. Injected nlrc3-like/ mutants show no microglia or partial rescue (more than five microglia) at 6 dpf, but no mutants are rescued to the wild-type level. In contrast, RNA injection does fully rescue microglia in some mutants at earlier stages ( Figure S1). (D) Graph shows relative proinflammatory transcript levels after transient rescue of nlrc3-like/ mutants by injection of wild-type nlrc3-like mRNA at one-cell stage. Injected mutants with no microglia at 6 dpf have elevated levels of proinflammatory cytokine transcripts that are similar to uninjected mutants. In contrast, mutants with partial rescue of microglia at 6 dpf have lower levels of il-8 and tnf-α expression, indicating that the number of microglia correlates inversely to the extent of inflammatory cytokine expression. Individual plots are normalized to their corresponding wild-type siblings, either uninjected or injected. Numbers below bar graphs represent n, number of embryos analyzed. Error bars show SEM. p < 0.05, one-tailed Student’s t test. n.s., not significant. See also Figures S4 and S5. |

NLRC3-like Negatively Regulates Inflammatory Signaling through Macrophages and May Interact with the Inflammasome Component ASC and Other Pyrin and NACHT-Containing Proteins (A) Macrophage mfap4 expression shows complete macrophage ablation by irf8 MO injection at 2 dpf (arrow). Injected wild-type embryos show complete loss of neutral red-positive microglia (n = 29/29; data not shown). (B) Graph shows relative il-1β mRNA levels, with pairwise comparisons indicated by the dotted lines. Depletion of macrophages in nlrc3-like mutants (mut) reduces il-1β and other proinflammatory cytokine levels similar to wild-type (WT) levels. sib, siblings. (C) SDS-PAGE analyses of reciprocal pull-down assays show binding of zebrafish ASC with NLRC3-like (lanes 2 and 4) and minimal binding to tag-alone controls (lanes 1 and 3). MBP-tagged full-length NLRC3-like runs near 160 kDa (blue arrowhead) with several smaller processed forms; GST-ASC at 50 kDa; MBP alone from pMAL-c2X vector at 50 kDa; and GST alone at 30 kDa. Blot shows 0.4% of the input prey protein per lane. (D) Top view is a schematic of the wild-type NLRC3-like protein and deletion versions: NLRC3-like- δpyrin with deletion at amino acids (aa) 230–269 and NLRC3-like-δNACHT with deletion at aa 357–518. At the bottom is a bar graph showing rescue of st73 mutants (87.5%, n = 16) by injection of mRNA encoding wild-type NLRC3-like, but none using the mutant constructs. Numbers at left edge of bar graphs represent n, number of embryos analyzed. Error bars show SEM. p < 0.05. |

Exposure of nlrc3-like Heterozygous Embryos to Systemic LPS Challenge Disrupts Microglia Development (A) Neutral red staining at 3 dpf shows normal formation of microglia in control uninjected nlrc3-like heterozygous embryos. In contrast, many nlrc3-like heterozygous embryos injected with LPS at 1 and 2 dpf have strongly reduced (6–16 microglia) or eliminated (0–5 microglia) microglia. (B) Bar graph shows the frequency of loss of microglia in nlrc3-like heterozygous fish injected with LPS, compared with little effect on the wild-type siblings. PHENOTYPE:
|

Injection of full-length wildtype nlrc3-like mRNA can fully rescue microglia in nlrc3-like–/– mutants, Related to Figure 1. (A) Images of embryos injected with synthetic nlrc3-like mRNA at the 1-4 cell stage and uninjected controls. At 4–5 dpf, neutral red staining showed that introduction of synthetic nlrc3-like mRNA can fully (e 30 microglia) or partially (6–29 microglia) rescue the nlrc3-like mutants; there was no change in microglia formation in injected heterozygous or wildtype siblings. Dorsal views; anterior to the top. (B) Graph showing frequency of the different classes of microglia number (0–5, 6–29, or e 30 microglia) in the indicated genotypes in control (uninjected or water injected) and nlrc3-like mRNA injected groups. Number below bar graph represents n, number of embryos analyzed. |
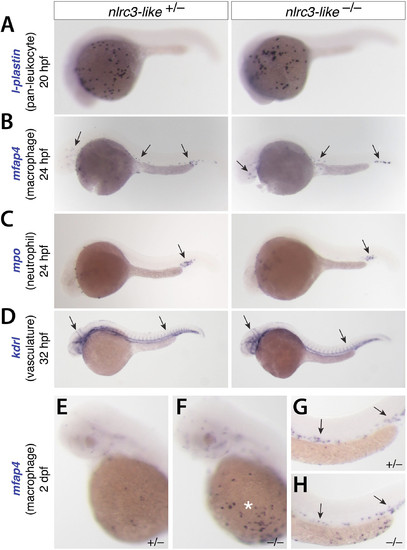
Early formation of primitive macrophages, neutrophils, and the vasculature appear normal in nlrc3-like–/– mutants, Related to Figure 2. The images show embryos analyzed by whole mount in situ hybridization. (A) At 20 hpf there was no apparent difference in expression in l-plastin, a marker of all leukocytes. (B) At 24 hpf, mfap4 expression indicated normal formation and migration of primitive macrophages into the embryo proper in mutants and siblings (arrows). (C) At 24 hpf, mpo expression showed no difference (arrow) between mutants and siblings. (D) Vasculature formed normally in the mutants, based on the expression pattern of the endothelial marker kdrl at 32 hpf (arrows). (E–H) mfap4 expression at 2 dpf shows the abundance of macrophages in the periphery of nlrc3-like mutants. Compared with heterozygous siblings (E), mutants (F) have abnormal aggregations of macrophages in the yolk sac (asterisk), but similar pattern of macrophages in the caudal vein (G–H, arrows). All panels show lateral views, with anterior to the left and dorsal to the top. |
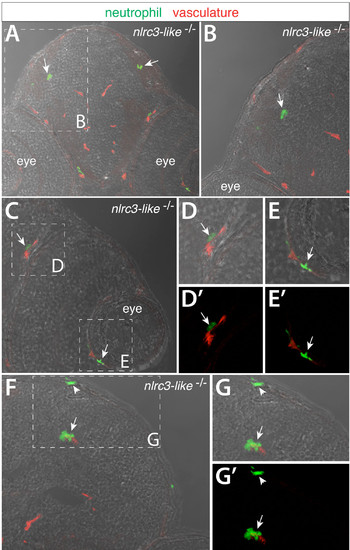
Transverse sections through the head of nlrc3-like–/– embryos at 2.5 dpf show neutrophils that have infiltrated the brain parenchyma and other locations, Related to Figure 4. Cryosections through the head of double transgenic nlrc3-like mutant embryos labeled by neutrophil reporter lyz:EGFP and vasculature marker kdrl:mCherry- CAAX. Images show overlay of GFP and mCherry expression on the bright field image. (A) In nlrc3-like mutants, lyz:EGFP + neutrophils are found intermixed with cells in the brain parenchyma independent of the vasculature in red (arrows). (B) Higher magnification of A as demarcated by the white dotted box. Neutrophils in the mutant are also often found within or surrounding eye vasculature (C–E). (D–E) Higher magnification of the boxed regions in C. (D′–E′) Red and green fluorescent overlay of the same image as D–E respectively. (F–G) Neutrophils are also associated with brain vessels (arrow) and in or near the dorsal head epithelium (arrowhead). |
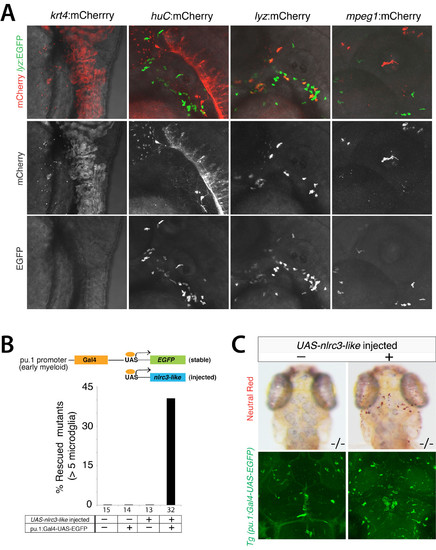
Tissue-specific promoter constructs drive expression in a tissue restricted manner; restoring nlrc3-like expression using the myeloid pu.1 driver rescues microglia in nlrc3-like–/– mutants, Related to Figure 5. (A) Top row, merged images showing lyz:EGFP stable transgene expression that marks neutrophils and control mCherry expression under the control of different tissue promoters as indicated at 2 dpf. Neutrophil reporter lyz:EGFP provides a reference to indicate the locations where leukocytes normally reside, and to distinguish the neutrophil lyz promoter from the macrophage mpeg1 driver. Top row, merged images of mCherry and EGFP expression; middle row, mCherry expression only from the construct injected; bottom row, stable neurtrophil transgene lyz:EGFP expression only. (B) Schematic showing the Gal4/UAS system applied to drive nlrc3-like in early myeloid cells under the control of the pu.1 promoter. Bar graph showing that 41% of mutants having both the pu.1: Gal4- UAS-EGFP driver and UAS-nlrc3-like construct are rescued, with > 5 microglia. There was no rescue in mutants missing at least one component of the Gal4/UAS system for nlrc3-like expression. (C) Representative images showing rescue of a 4 dpf mutant using the Gal4/UAS system (right). Top row, neutral red staining to visualize microglia, and bottom row, images showing UAS-GFP expression in the same larvae as above, indicating robust activity of the pu.1:Gal4 driver. Number below bar graph represents n, number of mutants analyzed. |