
- Title
-
Notch3 establishes brain vascular integrity by regulating pericyte number
- Authors
- Wang, Y., Pan, L., Moens, C.B., and Appel, B.
- Source
- Full text @ Development
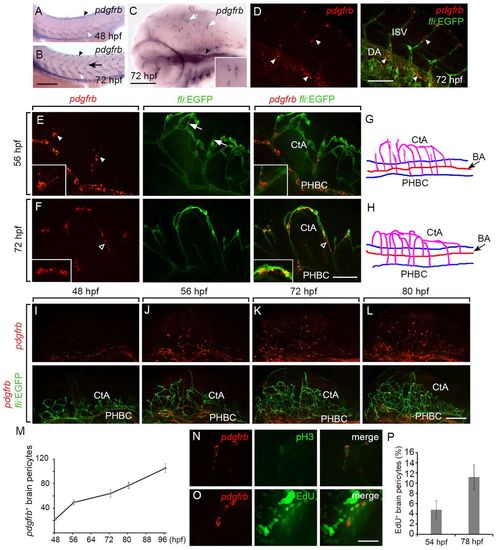
pdgfrb expression marks brain pericytes in zebrafish embryos and larvae. (A,B) pdgfrb expression detected by ISH in trunk vasculature. Black arrowheads, DLAV; white arrowheads, DA; arrow, ISV. (C) pdgfrb expression in head vessels. Black arrowhead, primary head sinus; white arrows, pdgfrb+ cells associated with central arteries. Inset shows a high magnification view of pdgfrb+ cells in the brain. (D) Fluorescence ISH showing pdgfrb expression in trunk vessels (arrowheads). (E,F) Confocal sections showing pdgfrb expression in the hindbrain vasculature at 56 and 72 hpf, respectively. Arrowheads, Y-shape cell body of a pdgfrb+ pericyte; arrows, sprouting endothelial tip cells; open arrowhead, spindle-like cell body of a pdgfrb+ pericyte. Insets show a high magnification view of the pdgfrb+ pericytes. (G,H) Diagrams depicting hindbrain vasculatures at 56 hpf (G) and 72 hpf (H). (I-L) Confocal projections showing pdgfrb+ pericytes in the entire brain at 48, 56, 72 and 80 hpf. (M) Quantification of pdgfrb+ brain pericytes at different time points during embryonic and larval development (48 hpf and 56 hpf, n=15 each; other time points, n=30 each). (N) pH3+ pdgfrb+ brain pericyte at 78 hpf. (O) EdU+ pdgfrb+ brain pericyte at 78 hpf. (P) Percentage of EdU+ brain pericytes labeled by a 1-hour pulse at 54 hpf and 78 hpf (n=15 each). Error bars represent s.d. BA, basal artery; CtA, central artery; DA, dorsal aorta; ISV, intersegmental vessels; PHBC, primary hindbrain channels. Scale bars: 0.5 mm (A,B); 250 µm (C); 200 μm (D-F,I-L); 40 μm (N,O). EXPRESSION / LABELING:
|

Zebrafish pericytes express notch3. (A,B) notch3 expression in the trunk vessels. Arrowheads, DA; arrow, ISVs; asterisk, neural expression. (C,D) Fluorescence ISH showing notch3 expression in trunk (C) and brain pericytes (D). Arrowheads indicate notch3+ pericytes and asterisk marks neural expression. Inset shows a high magnification view of a notch3+ pericyte. (E) Double fluorescence ISH showing colocalization of pdgfrb and notch3 transcripts in brain pericytes. Asterisks mark neural expression of notch3. (F,G) Double fluorescence ISH showing colocalization of pdgfrb and notch3 transcripts in trunk vessels. (F) Confocal section showing ISV pericytes. (G) DA mural cells. Arrows indicate pdgfrb+ notch3+ pericytes. Insets show high magnification views of pdgfrb and notch3 co-expression in pericytes. CtA, central artery; DA, dorsal aorta; ISV, intersegmental vessels. Scale bars: 200 μm. EXPRESSION / LABELING:
|

notch3fh332 mutant larvae have brain hemorrhage and a defective BBB. (A-D) Examples of brain hemorrhage in 3 dpf notch3fh332 mutant larvae. (A-C) Lateral view. (D) Dorsal view. Arrowheads indicate blood pooling in the brain ventricle. Insets show high magnification view of the hemorrhage in the brain ventricle. (E-H) Representative results of BBB assay in 4 dpf wild-type (WT) and mutant larvae. (E,F) Lateral views of the brain. (G,H) Dorsal views of the midbrain and hindbrain. Mutant embryos failed to retain 2000 kD Alexa488-dextran in the brain microvessels 90 minutes after the injection. Arrowheads and arrows indicate brain vessels in the wild-type and mutant larvae, respectively. (I-L) Immunostaining of 3 dpf wild-type and mutant larvae with Claudin 5 and ZO-1 antibodies. Arrowheads indicate Claudin 5 or ZO-1 staining at the blood vessels. Open arrowheads indicate ZO-1 staining along brain ventricular wall. Scale bar: 200 μm. EXPRESSION / LABELING:
PHENOTYPE:
|

notch3fh332 mutants have a deficit of pericytes. (A-F) pdgfrb+ brain pericytes in wild-type (WT) and mutant fish. Arrowheads, pdgfrb+ pericytes in the mutant larvae; open arrowheads, reduced vessel branching in forebrain and hindbrain. All images show confocal projections of whole brains from lateral view with dorsal up and anterior to the left. (G) Quantification of pdgfrb+ brain pericytes at different time points during embryonic and larval development in wild-type and mutant fish (ne25 each). *P<0.001 by Student’s two-tailed t-test. Scale bar: 200 μm. |
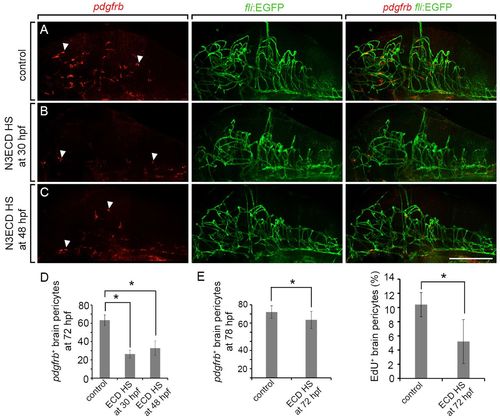
Notch3 is required for brain pericyte proliferation. (A-C) N3ECD-GFP overexpression results in fewer pdgfrb+ brain pericytes at 72 hpf. (A) Non-transgenic control fish. (B,C) Tg(hsp70I:N3ECD-GFP) larvae heat-shocked at 30 hpf and 48 hpf. Arrowheads, pdgfrb+ brain pericytes. (D) Quantification of pdgfrb+ brain pericytes in control and Tg(hsp70I:N3ECD-GFP) larvae at 72 hpf (ne31 each). (E) Quantification of brain pericytes and percentage of EdU+ pericytes in control and Tg(hsp70I:N3ECD-GFP) larvae heat-shocked at 72 hpf and EdU pulsed at 78 hpf (n=42 each). Error bars represent s.d. *P<0.001 by Student’s two-tailed t-test. Scale bar: 200 μm. EXPRESSION / LABELING:
PHENOTYPE:
|

Notch3 is sufficient to promote brain pericyte proliferation. (A,B) N3ICD-EGFP overexpression increased the number of pdgfrb+ brain pericytes at 72 hpf. (A) Non-transgenic control larvae. (B) Tg(hsp70I:N3ICD-EGFP) larva heat-shocked (HS) at 48 hpf. (C,D) N3ICD overexpression rescued the brain pericyte deficit phenotype in notch3fh332 mutant larvae at 72 hpf. (C) notch3fh332 homozygous larvae heat-shocked at 48 hpf. (D) notch3fh332 homozygous larvae carrying the Tg(hsp70I:N3ICD-EGFP) transgene and heat shocked at 48 hpf. Arrowheads, pdgfrb+ brain pericytes. (E) Quantification of pdgfrb+ brain pericytes in control and N3ICD fish at 72 hpf (n=30 each). (F) Quantification of brain pericytes and percentage of EdU+ pericytes in control and N3ICD fish heat-shocked at 72 hpf and EdU pulsed at 78 hpf (n=25 each). (G) Quantification of brain pericytes at 72 hpf in control larvae, N3ICD larvae heat-shocked at 48 hpf, control larvae treated with 25 µM AG1295, and N3ICD larvae heat-shocked at 48 hpf immediately followed by AG1295 treatment (ne20 each). (H) Quantification of brain pericytes at 72 hpf in notch3fh332 larvae heat shocked at 48 hpf (control group) and notch3fh332;Tg(hsp70I: N3ICD-EGFP) larvae heat shocked at 48 hpf. Error bars represent s.d. *P<0.001 by Student’s two-tailed t-test. Scale bar: 200 μm. EXPRESSION / LABELING:
PHENOTYPE:
|

Expression patterns of tagln2 and pdgfrb in zebrafish embryos and larvae. (A-C) ISH for tagln2. (A,B) tagln2 expression in trunk vessels at 48 hpf and 72 hpf, respectively. Arrowhead, tagln2+ putative mural cell in ISV. (C,D) tagln2 expression in brain vasculature at 48 hpf and 72 hpf. Arrow, tagln2+ putative brain mural cell. Inset, high magnification view of tagln2+ cells in the brain. (E-L) desmina, desminb, rgs5a, and cspg4 expression in trunk and brain vasculature at 72 hpf. (E,G,I,K) trunk expression. (F,H,J,L) brain expression. (M) Fluorescent ISH showing pdgfrb expression in retinal pericytes at 72 hpf. Arrowheads, pdgfrb+ retinal pericytes. (N) Quantification of pdgfrb+ pericytes associated with different hindbrain vessels at various time points. (O,P) foxd3 MO knockdown caused reduction in pdgfrb+ brain pericyte number. (O) Control MO-injected 72 hpf larva. (P) foxd3 MO-injected 72 hpf larva. Arrowheads, pdgfrb+ brain pericytes. HA, hyaloid artery; HV, hyaloid vessels. Scale bars: (A-L) 0.5 mm, (M-P) 200 μm. EXPRESSION / LABELING:
|

notch3fh332 mutants have reduced Notch signaling activity. (A,B) Wild-type and notch3fh332 mutant larvae showing trunk curvature of the mutant at 3 dpf. (C-F) notch3fh332; Tg(Tp1bglob:hmgb1-mCherry) (Tp1:mCherry) mutant larvae showed reduced mCherry expression compared to wild-type siblings at 3 dpf and 5 dpf. (G,H) Whole-mount ISH revealed similar her4.1 expression in notch3fh332 mutant and wild-type sibling. (I-L) notch3fh332 mutants showed reduced hey1 and her9 expression compared to wild-type siblings. PHENOTYPE:
|

Endothelial cell differentiation in notch3fh332 mutant larvae. (A-H) Representative results of BBB assay in 4 dpf wildtype and mutant larvae using 10KD FITC-dextran and Evans blue dye. Insets, higher magnification view of brain microvessels. (AD) Mutant embryos failed to retain 10KD FITC-dextran in the brain microvessels 20 min after the injection. (E-H) Mutant embryos failed to retain Evans blue dye in the brain microvessels 30 min after the injection. (I-L) ISH showing cdh5 and cldn5b expression in the brain of 3 dpf wild-type and notch3fh332 larvae. Arrowheads, endothelial expression of cdh5 or cldn5b. (M-P) Electron microscopy images of brain microvessels in 4 dpf wild-type and notch3fh332 mutant larvae. RB, red blood cell. E, endothelial cell. Arrowheads, endothelial tight junctions. Scale bars: (I-L) 250 &mu:m, (M-P) 1μm. EXPRESSION / LABELING:
PHENOTYPE:
|
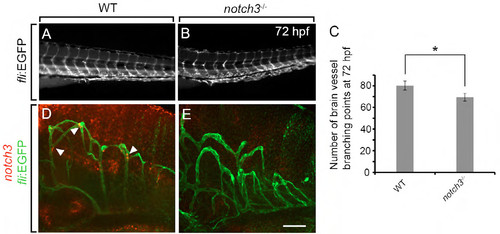
Vascular morphogenesis and brain notch3 expression in notch3fh332 mutants. (A,B) fli1:EGFP transgenic reporter expression showing trunk vessels in 72 hpf wild-type and notch3fh332 mutant larvae. (C) Quantification of vessel branch points in the brain of notch3fh332 mutant and wild-type larvae. (D,E) Fluorescent ISH showing notch3 expression in the hindbrain. Pericyte notch3 expression was largely depleted in the mutant. Arrowheads, notch3+ pericytes. *P<0.01 by Student’s 2-tailed t test. Scale bar, 200 μm. PHENOTYPE:
|

notch3 MO phenocopied the pericyte deficit phenotype in notch3fh332 mutant larvae. (A,B) Fluorescent ISH showing pdgfrb+ brain pericytes in 72 hpf control and notch3 MO-injected larvae. Arrowheads, pdgfrb+ pericytes. Scale bar, 200 μm. |
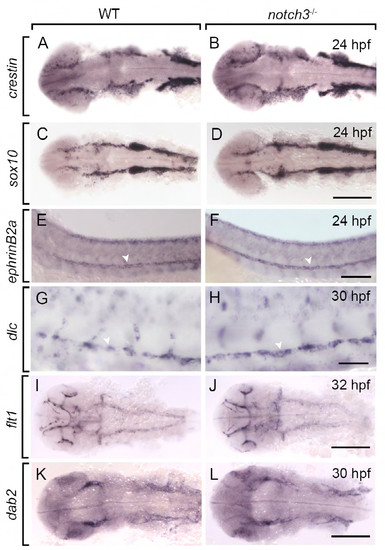
Arterial-venous differentiation and neural crest development in notch3fh332 mutant larvae. (A-D) ISH showing crestin and sox10 expression in 24 hpf wild-type and notch3fh332 mutant larvae. (E,F) ISH showing efnb2a expression in 24 hpf wild-type and notch3fh332 mutant larvae. (G,H) ISH showing dlc expression in 30 hpf wild-type and notch3fh332 mutant larvae. Arrowheads, DA. (I,J) ISH showing flt1 expression in 32 hpf wild-type and notch3fh332 mutant larvae. (K,L) ISH showing dab2 expression in 30 hpf wildtype and notch3fh332 mutant larvae. Scale bars: (A-F) 0.5 mm, (G,H) 200 μm. (I-L) 0.5mm. |
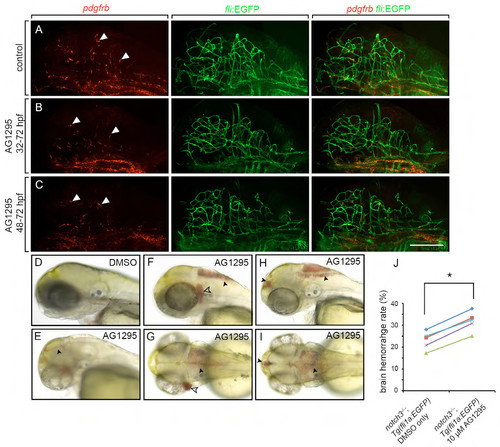
Inhibition of Pdgfr-β activity produces a pericyte deficit and brain hemorrahge. (A) pdgfrb+ brain pericytes in DMSO treated control larvae. (B,C) Larvae treated with 25 μM AG1295 from 32-72 hpf, and from 48-72 hpf, respectively, showed a reduction in pdgfrb+ brain pericyte number. Arrowheads, pdgfrb+ brain pericytes. Scale bar, 200 μm. (A-C) All images show confocal projections of whole brains, viewed from lateral. (D-I) Brain hemorrhage in AG1295 treated zebrafish larvae. (D) DMSO treated control at 3 dpf. (F-I) 25μm AG1295 treated larva at 3 dpf. (E,F,H) Lateral views. (G,I) Dorsal views of (F,H), respectively. (J) notch3fh332 homozygous mutants showed a more penetrant hemorrhage phenotype when treated with 10 μM AG1295 (n=5, *P<0.05, by paired t-test). Arrowheads, blood pooling at the brain ventricle; open arrowhead, blood pooling behind the eye. |
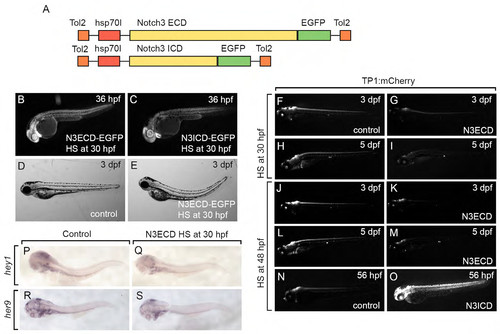
Organization and transgene expression for Tg(hsp70I:Notch3ECD-EGFP) and Tg(hsp70I:Notch3ICD-EGFP) transgenic constructs. (A) Diagram depicting the organization of Tg(hsp70I:Notch3ECD-EGFP) and Tg(hsp70I:Notch3ICD-EGFP) transgenic constructs. (B,C) Heat shock of Tg(hsp70I:Notch3ECD-EGFP) embryos (B) and Tg(hsp70I:Notch3CD-EGFP) embryos (C) at 30 hpf induced robust EGFP expression. (D,E) Heat shock of Tg(hsp70I:Notch3ECD-EGFP) embryos at 30 hpf resulted in trunk curvature at 3 dpf. (F-M) Heat shock of Tg(hsp70I:Notch3ECD-EGFP); Tg(Tp1bglob:hmgb1-mCherry) embryos at 48 hpf or 30 hpf caused significant reduction in mCherry intensity at 3 dpf and 5 dpf. (N,O) Heat shock of Tg(hsp70I:Notch3ICD-EGFP); Tg(Tp1bglob:hmgb1-mCherry) embryos at 48 hpf resulted in significantly increased mCherry fluorescent intensity at 56 hpf. (P-S) Tg(hsp70I:N3ECD-EGFP) larvae heat-shocked at 30 hpf showed reduced heyl and her9 expression compared to control group. |
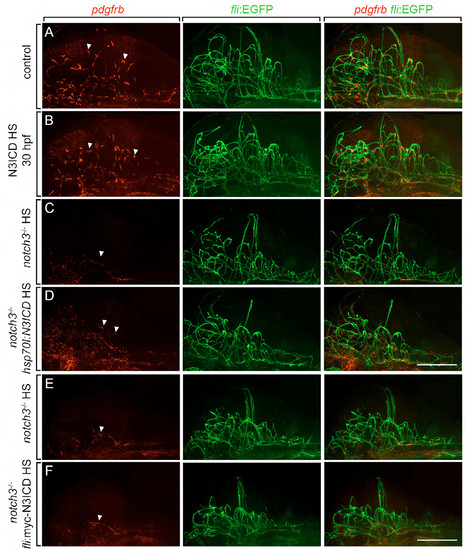
Notch3 is insufficient to induce ectopic brain pericyte specification and forced Notch3ICD expression in the endothelium failed to rescue the pericyte deficit in notch3fh332 larvae. (A,B) Heat shock of Tg(hsp70I:Notch3ICD-EGFP) embryos at 30 hpf did not result in increase of brain pericyte number at 72 hpf. (A) Non-transgenic control larvae. (B) Tg(hsp70I:N3ICDEGFP) larva heat shocked at 30 hpf. (C,D) Transient N3ICD overexpression partially rescued the brain pericyte deficit phenotype in notch3fh332 mutant larvae at 72 hpf. (C) notch3fh332 mutant mock-injected control. (D) notch3fh332 mutant injected with hsp70I:N3ICDGFP construct and heatshocked at 48 hpf. (E,F) Transient N3ICD expression in endothelial cells failed to rescue the brain pericyte deficit phenotype in notch3fh332 mutant larvae. (E) notch3fh332 mutant mock-injected control. (F) notch3fh332 mutant injected with fli1:myc-Notch3ICD construct and heat shocked at 48 hpf. Arrowheads, pdgfrb+ brain pericytes. Scale bar, 200 μm. |