
- Title
-
Precocious acquisition of neuroepithelial character in the eye field underlies the onset of eye morphogenesis
- Authors
- Ivanovitch, K., Cavodeassi, F., and Wilson, S.W.
- Source
- Full text @ Dev. Cell
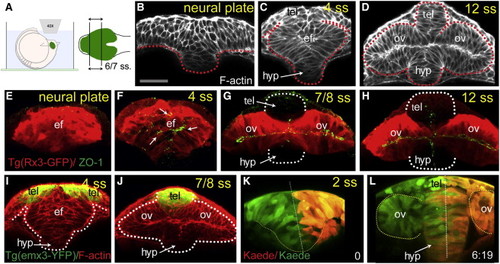
Reduced Convergence and Precocious AB Polarization of Eye Field Cells (A) These panels and those in other figures show transverse (frontal) confocal sections through the developing ANP at the level of the eye field/optic vesicles, imaged as schematized in (A). (B–D) Wild-type embryos stained with F-actin to reveal cellular organization. tel, telencephalon; ef, eye field; hyp, hypothalamus; ov, optic vesicle. Scale bar, 64 μm (B). (E–H) Tg(rx3:gfp) embryos immunostained against GFP (red) and ZO-1 (green/yellow, arrows in F) to reveal cell polarity. (I and J) Tg(emx3:yfp) embryos immunostained against GFP (green) and stained for F-actin (red), showing the reorganization of the telencephalon that accompanies optic vesicle evagination. (K and L) Initial (K) and final (L) time points of a time-lapse movie sequence of an embryo expressing Kaede. One-half of the neural plate was photoconverted from green to red by UV illumination (t = 0). White dotted lines in (G) and (H) outline the telencephalon and hypothalamus; red/white lines in (B)–(D) and (K) and (L) outline the neural anlage. See also Figure S1 and Movie S1. |

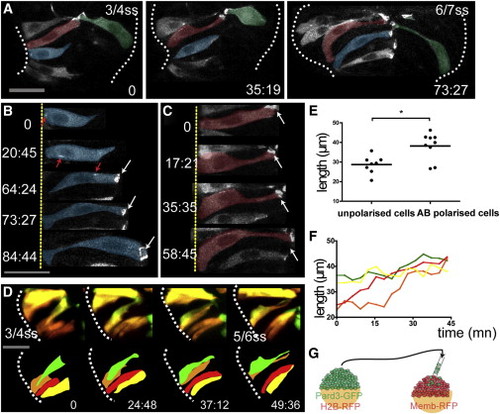
Two Morphologically Distinct Cell Populations within the Forming Optic Vesicles (A–F) Time-lapse movie from neural plate-1 ss (t = 0 min, 10.5 hpf) up to 8–9 ss (t = 332 min, around 13.5 hpf) of an embryo ubiquitously expressing membrane-RFP (red) and H2B-GFP (green). The yellow dotted line highlights the neural anlage at t = 0 (A) and the eye field/optic vesicles at subsequent time points. Example marginal and core cells are outlined in white (B–F). Detailed morphology is not evident at this magnification but can be seen in (G) and in other figures. Scale bar, 64 μm (A). (G) Membrane-GFP labeling of typical core and marginal cells at 4 ss. Scale bar, 27 μm. (H) Quantification of the cell length (i, iii, and v) and the cell rdn index (ii, iv, and vi) of marginal (blue) and core (red) cells. Black bars indicate mean (Mann-Whitney U test). Numbers of cells quantified are as follows: (i) cell length at 4–5 ss, n = 56 marginal cells in eight embryos and n = 48 core cells in five embryos; (ii) rdn index at 4–5 ss, n = 71 marginal cells in eight embryos and n = 62 core cells in five embryos; (iii) cell length at 6–7 ss, n = 73 marginal cells in eight embryos and n = 26 core cells in five embryos; (iv) rdn index at 6–7 ss, n = 63 marginal cells in eight embryos and n = 53 core cells in five embryos; (v) marginal cell length at 9–10 ss, n = 58 cells in five embryos; and (vi) marginal cell rdn at 9–10 ss, n = 38 cells in four embryos. In order to distinguish unambiguously the shape of single eye field cells, in three-dimensions, large z stacks (60 μm in average) were acquired on mosaically labeled whole-mount embryos. See also Movie S2. |
Marginal Eye Field Cells Acquire AB Polarity in a Coordinated Manner (A) Time-lapse movie of cells in the eye field of an embryo mosaically expressing Pard3-GFP. Cells are pseudocolored for clarity. (B and C) High-resolution images of two marginal cells extracted from the movie in (A) as they polarize. Red arrows in (B) show Pard3-GFP punctae as they are transported apically. White arrows in (B) and (C) show apical accumulation of Pard3-GFP. (D) Time-lapse movie of cells in the eye field of an embryo mosaically labeled with Kaede. Single cells were photoconverted from green to red by illumination with UV light. Four adjacent marginal cells are followed as they gradually coordinate their length. (E) Unpolarized marginal cells are shorter than the polarized ones (black bar indicates mean [Mann-Whitney U test]; n = 30 from five embryos). (F) Quantification of cell length of the four adjacent marginal cells in (D) over time (cell length is measured every 4.50 min). (G) Schematic showing the experimental strategy. White dotted lines (A) and (D) outline the eye field. Scale bars, 27 μm (A, B, and D). See also Figure S2 and Movie S3. |
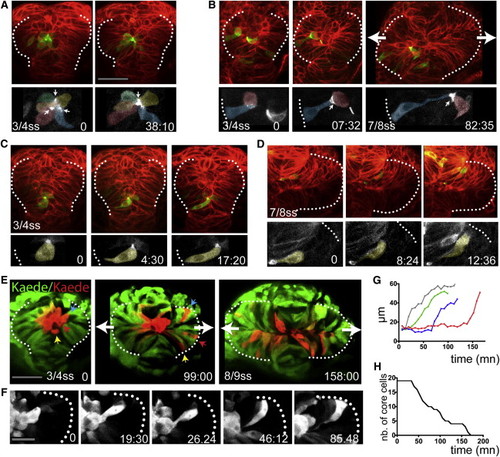
Core Eye Field Cells Polarize and Intercalate in the Marginal Layer during Eye Morphogenesis (A–D) Time-lapse movies of eye field core cells expressing the fusion protein Pard3-GFP (green). Embryos are counterlabeled with a membrane-RFP (red). Insets below show the green channel only (Pard3-GFP). (E) Time-lapse movie of an embryo expressing Kaede. Core cells were labeled in red by photoconversion of Kaede from green to red. Colored arrows point at individual core cells as they intercalate within the optic vesicles. (F) Close-up of a single core cell elongating and acquiring a wedge shape as it intercalates. (G) Quantification of cell length over time in individual core cells with data extracted from the movie sequence in (E). (H) Graph showing the reduction in the number of core cells as morphogenesis proceeds (18 core cells were tracked from t = 0 onward). White dotted lines in (A)–(F) outline the eye field. Lateral arrows in (B) and (E) indicate the direction of evagination of the tissue. Scale bars, 64 μm (A and E) and 27 μm (F). See also Figure S3 and Movies S4, S5, S6, S7, and S8. |

Cells Shorten at Late Stages of Optic Vesicle Evagination (A and B) Time-lapse movie starting at around 8–9 ss (z stack projection, six z slices, 5 μm intervals) of evaginating optic vesicles in an embryo mosaically labeled with Kaede. (C) Time-lapse movie starting at around 8–9 ss of a cell expressing the fusion protein Pard3-GFP in the eye field of an embryo ubiquitously expressing a membrane localized RFP fusion protein, as it shortens (green arrows). (D) Schematic of the labeled cell in (C). (E) Quantification of cell length over time (five cells were followed from around 6–7 ss in two embryos; cell length was measured at around every 5–6 min). White (A) and blue (B and C) dotted lines outline the edge of the optic vesicles, red dotted lines in (A) highlight the midline of the embryo, and yellow dotted boxes in (A) correspond to the regions shown in (B). Scale bars, 64 μm (A) and 27 μm (C). |

Laminin1 and Pard6γβ Are Required for Eye Morphogenesis Progression (A) Eye field and optic vesicles of fixed Tg(rx3:gfp) embryos immunostained against ZO-1 (green), Laminin1 (red), and GFP (blue). (B) Tg(rx3:gfp) and Tg(rx3:gfp)/sly optic vesicles immunostained against GFP (red) and ZO-1 (green). White arrows point to ZO-1 mis-localizing basally within the optic vesicles. (C) Transplants of Tg(rx3:gfp) expressing cells into nontransgenic hosts are shown: wild-type cells into wild-type embryos (Ci) and lamininγ1 morphant cells into lamininγ1 morphant embryos (Cii), immunostained against GFP (green), ZO-1 (red), and F-actin (blue), showing the disrupted epithelial organization (Cii) and the aberrant AB polarity axis (Ciii) in lamininγ1 morphants. (D) Time-lapse movie of a lamininγ1 morphant marginal cell expressing Pard3-GFP. (E) Changes in cell length over time of a wild-type (blue) and lamininγ1 morphant (red) marginal cell transplanted into wild-type and morphant hosts, respectively. (F) Measurement of cell rdn index of 6–7 ss eye field cells in a wild-type (blue) and lamininγ1 morphant embryo (red); lamininγ1 morphant eye field cells are rounder than wild-type eye cells (wild-type, 0.34 ± 0.18; lamininγ1 MO, 0.58 ± 0.18, mean ± SD). Black bar indicates mean (Mann-Whitney U test). WT, n = 83 cells in five embryos, Lamininγ1 mo n = 66 cells in four embryos, p < 0.0001. All eye field cells (marginal and core) have been included in the measurement. (G) lamininγ1 morphant eye cells (presumptive core and marginal in red) are similar in their rdn index to core wild-type cells (blue). Black bar indicates mean (Mann-Whitney U test). WT core cells, n = 53 core cells in five embryos; Lamininγ1 morphant, n = 66 cells in four embryos, p = 0.5436. (H, I, K, and L) Images showing apical polarity organization of cells (labeled by Pard3-GFP, green) in the optic vesicles of embryos in which Laminin1-coated (H and I) or BSA-coated (K and L) beads were implanted in the center of the eye field. See also Movie S9. BF, bright field. (J and M) Schematics illustrating the organization of cells around beads in the eyes from (H) and (K). (N) Tg(rx3:GFP) (Ni), Tg(rx3:GFP);pard6γβMo (Nii), and Tg(rx3:GFP);sly;pard6γβMo (Niii) embryos stained as detailed in the figure. The arrow in (Nii) points at defective polarization in pard6γβ morphants. White lines in (C), (H), and (I) outline the margins of the eye field. Scale bars, 27 µm (A–D and N). See also Figure S4 and Movie S9. |

(A-C) 4ss Tg(rx3:GFP) embryos immunostained as detailed in the panels [ZO-1 (green in A, red in B and C), F-actin (red, A) and aPKC (green in B)]. Inset boxes showing F-actin and aPKC, and ZO- 1 and aPKC colocalise in the eye field at 4ss. aPKC can sometimes localise apically to ZO-1 (C). (D) View of the eyefield of a wildtype embryo injected with mRNA for H2b-RFP to label the nuclei and centrin-GFP to label centrosomes, showing accumulation of this marker at the centre of the eye field. White dotted lines in (D) outline the eye field. tel: telencephalon; ef: eye field. (E-F) in situ hybridization to detect pard6γβ in the eye field of wildtype (E) and rx3chk mutant embryos (F). |
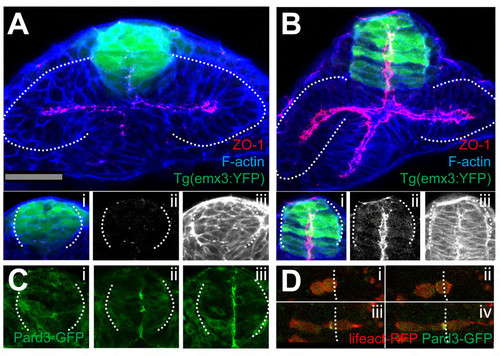
(A-B) 9ss (A) and 11ss (B) Tg(emx3:YFP) embryos immunostained as detailed in the panels. (Ai, ii, iii) and (Bi, ii, iii) show high magnifications of the telencephalic domain. ZO-1 is only weakly expressed at 9ss (Aii) but by 11ss, it is strongly expressed adjacent to the lumen of the telencephalon (Bii). (C) Snapshots from a time lapse movie of a pard3-GFP mRNA injected embryo, at 9ss (i), 11ss (ii) and 12ss (iii), showing the gradual appearance of polarisation in the telencephalon. (D) high-resolution detail of a telencephalic cell expressing lifeact-RFP and pard3-GFP, as it undergoes a midline cell division and its daughter cells establish apical domains at the telencephalic midline. White dotted lines in (A-B) outline the eye field; lines in (Ai-iii; Bi-iii; Ci-iii) outline the telencephalon. Vertical dotted lines in (D) highlight the future midline. |
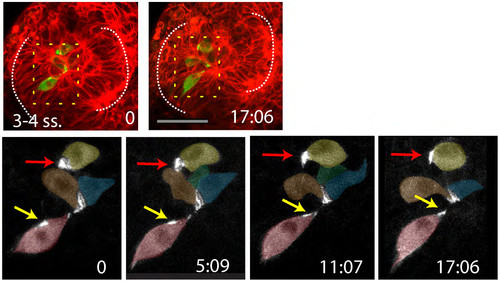
Time-lapse movie sequence of eye field core cells expressing the fusion protein Pard3-GFP (green). The embryo is counter-labeled with a membrane-RFP (red). Insets below show the green channel only (Pard3-GFP). A subset of the labelled core cells coordinate their subcellular polarised localisation of Pard3-GFP and organise as a rosette-like structure (follow the yellow arrow, n=5 in 4 embryos). Some others did not do so (red arrow). |
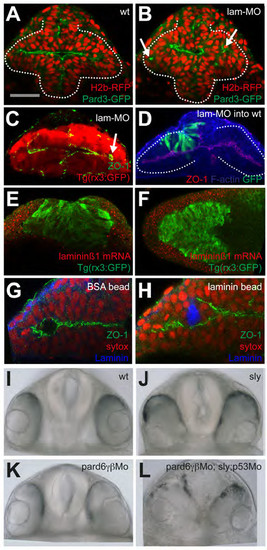
(A-B) wildtype and laminin-γ1 morphants, respectively, expressing H2b-RFP and Pard3- GFP. Arrows in (B) point at mis-positioned pard3-GFP puncta in the eye field of the laminin- γ1 morphant. (C) laminin-γ1 morphant immunostained as detailed in the panel. Arrows point at mispositioned ZO-1 puncta. (D) laminin-γ1 morphant cells (green) transplanted into a wild type eye field show no overt phenotype. Embryo immunostained as detailed in the panel. (E-F) frontal and dorsal views, respectively, of 3ss Tg(rx3:GFP) embryos showing laminin-β1 mRNA accumulation (red) and GFP protein (green). laminin-α1 and laminin-γ1 show similar expression patterns (not shown). (G-H) BSA-coated (G) and Laminin1-coated (H) beads implanted in the eye field. Embryos were left to develop until 10ss and immunostained as detailed in the panels. (I-L) Frontal views of 24hpf embryos of the genotypes detailed in the panels. |
Reprinted from Developmental Cell, 27(3), Ivanovitch, K., Cavodeassi, F., and Wilson, S.W., Precocious acquisition of neuroepithelial character in the eye field underlies the onset of eye morphogenesis, 293-305, Copyright (2013) with permission from Elsevier. Full text @ Dev. Cell