
- Title
-
High-affinity olfactory receptor for the death-associated odor cadaverine
- Authors
- Hussain, A., Saraiva, L.R., Ferrero, D.M., Ahuja, G., Krishna, V.S., Liberles, S.D., and Korsching, S.I.
- Source
- Full text @ Proc. Natl. Acad. Sci. USA
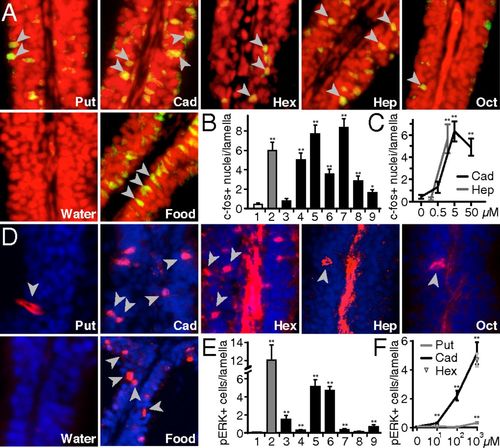
Diamines elicit c-Fos and pERK increase in olfactory sensory neurons. (A) Zebrafish (n = 21) were exposed to stimuli indicated (2 or 5 mM). c-Fos IHC (green) and nuclear staining (propidium iodide, red), enabled visualization of c-Fos+ nuclei (yellow), some emphasized by gray arrow heads. (B and C) Quantification of c-Fos+ nuclei/lamella as a function of diamine chain length (B) or concentration (C). Results from one representative experiment each are shown. Counting was done on randomized micrographs, values given represent mean ± SEM. Significance in comparison with water was evaluated by Student t test, *P < 0.05, **P < 0.01. (B) 1, water; 2, food extract; 3–8, numbers reflect carbon chain length of diamines; 9, diaminodecane. (D) Zebrafish (n = 14) were exposed to stimuli indicated (1 mM). Some pERK-labeled cells (red) are emphasized by gray arrowheads; nuclear counterstain (DAPI, blue). Red central stripes in some panels, unspecific label in the basal lamina outside the sensory region. (E and F) Quantification of pERK+ cells/lamella as function of chain length (E) or concentration (F). Values given represent mean ± SEM. Significance in comparison with water was evaluated by Student t test, **P < 0.01. (E) Results from two experiments are shown; 1, water; 2, food extract; 3–8, numbers reflect carbon chain length of diamines; 9, diaminodecane. (F) Evaluation was partly on randomized data, no difference was seen between randomized and nonrandomized evaluation. EXPRESSION / LABELING:
|

Cadaverine activates TAAR13c-expressing neurons. Zebrafish were exposed to cadaverine (cad) and putrescine (put) at concentrations indicated and processed for concomitant IHC of TAAR13c (green fluorescence) and pERK (red fluorescence). DAPI was used as nuclear counterstain (blue). Sometimes the basal lamina was stained unspecifically (green and red stripes in the center of some lamellae). Asterisks, pERK+ cells; arrows, colabeled cells (yellow) and pERK+/TAAR13c− cells (red). (Scale bars: 10 μm.) (Lower Left) Quantitative evaluation, values are given as normalized cell numbers (120–250 cells per condition were analyzed); green bar, TAAR13c+/pERK− cells; yellow bar, double label; red bar, TAAR13c−/pERK+ cells. EXPRESSION / LABELING:
|
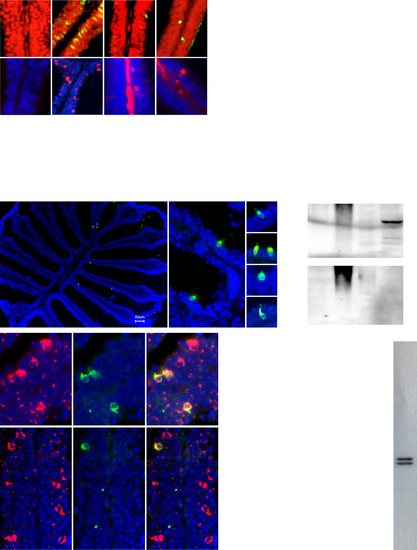
Additional data. (A) Diamines elicit c-Fos and pERK increase in olfactory sensory neurons. (Upper) Zebrafish (n = 12) were exposed to stimuli indicated (2 or 5 mM for diamines). c-Fos immunohistochemistry (green) and nuclear staining (propidium iodide, red), enabled visualization of c-Fos+ nuclei (yellow), some emphasized by gray arrow heads. (Lower) Zebrafish (n = 8) were exposed to stimuli indicated (1 mM). Some pERK-labeled cells (red) are emphasized by gray arrow heads; nuclear counterstain (DAPI, blue). Red central stripes in some panels, unspecific label in the basal lamina outside the sensory region. (B) Dosedependent activation of TAAR13c by dibasic ligands cystamine, agmatine, and histamine. HEK293 cells were transfected with TAAR13c plasmid and a reporter gene, incubated with chemicals at concentrations indicated, and assayed for reporter gene activity. Values are in relative units. A representative experiment is shown (n = 3 ± SEM). No responses to diamines were observed in cells transfected with reporter gene alone. Only activation by cystamine is saturable. For comparison, the dose–response curve of cadaverine is shown (gray). (C) Sequence alignment of the peptide sequence used for the generation of TAAR13c antibody with the corresponding segments from the four other members of the TAAR13 subfamily. Difference to the peptide sequence is shown as percentage (Right). (D) Anti-TAAR13c antibody labels a sparse population of olfactory sensory neurons (green) in horizontal sections of olfactory epithelium. (Left) A complete horizontal section contains only six TAAR13c+ olfactory sensory neurons; (Center and Right) TAAR13c+ cells at higher magnifications. Counterstain by DAPI (blue). (E) Western blot analysis of protein extracts from gills, heart, 5 d postferitilization embryo (Emb), and olfactory epithelium (OE), using anti- TAAR13c antibody. (Upper) The antibody recognizes a specific protein with apparent molecular weight of 55 kDa in the olfactory extract lane; (Lower) no such band was observed after preincubation of anti-TAAR13c antibody with 10× molar excess of peptide. Note that the high molecular weight band in heart (absent in OE) is not eliminated by preincubation with peptide. Arrowheads, molecular weight of reference proteins in kilodaltons. (F and G) Concomitant immunohistochemical detection of TAAR13c (green fluorescence) and Taar13c riboprobe (red fluorescence) in zebrafish olfactory rosettes. DAPI was used as nuclear counterstain (blue). Washes were performed at low (0.7× SSC, 65 °C) and high stringency (0.2× SSC, 65 °C). Quantification of these results is shown in G. Color code as indicated; ISH, in situ hybridization; IHC, immunohistochemistry. Several-fold more cells are labeled by the Taar13c riboprobe at low stringency (Upper), resulting in a smaller percentage of all labeled cells for the double-labeled neurons (Lower). (H) Quantification of TAAR13c/pERK colocalization. Zebrafish were exposed to cadaverine (cad) and putrescine (put) at concentrations indicated and processed for concomitant immunohistochemical detection of TAAR13c and pERK. Results were quantified, color code as indicated. (Upper) Number of cells normalized per TAAR13c+ cell; (Lower) cell populations are expressed as percent of all labeled cells. (I) Western blot analysis of protein extract from OE, using anti-pERK antibody. The antibody recognizes two specific bands with molecular weight corresponding to pERK1 and pERK2. Arrowheads, molecular weight of reference proteins in kilodaltons. |