
- Title
-
Teneurin-3 specifies morphological and functional connectivity of retinal ganglion cells in the vertebrate visual system
- Authors
- Antinucci, P., Nikolaou, N., Meyer, M.P., and Hindges, R.
- Source
- Full text @ Cell Rep.

Teneurin-3 Is Expressed in Interconnected Regions of the Zebrafish Visual System (A–C) Retinal cryosections of whole-mount in situ hybridizations showing tenm3 mRNA expression at 2, 3, and 5 dpf. (D and H) Control in situ hybridizations using sense tenm3 riboprobe. (E–G) Tectal cryosections of whole-mount in situ hybridizations showing tenm3 mRNA expression at 2, 3, and 5 dpf. All images are in transverse plane. Scale bar, 40 μm. N, neuropil; M, medial; V, ventral. (I) Schematic showing the expression pattern of tenm3 in the retina. Tenm3-positive cells are represented as blue circles. Neuropil layers are indicated in gray. Anatomical reference is reported on the right. IPL, inner plexiform layer; ONL, outer nuclear layer; OPL, outer plexiform layer. (J) Schematic showing the expression pattern of tenm3 in the optic tectum. (K) Schematic detailing the targeting site of splice-blocking tenm3 morpholino (MO), which is shown in red. Exons are represented in cyan. Solid lines indicate introns. The dashed line indicates exon 3 deletion caused by tenm3 MO injections. Primers used for RT-PCR (L) are reported as blue arrows. (L) RT-PCR analysis of tenm3 mRNA structure in control MO- and tenm3 MO-injected embryos. Two shorter splice variants are distinguished in tenm3 morphants. cDNA sequence comparison revealed that the shortest splice variant lacks exon 3. (M) Schematic detailing the effect of exon 3 deletion caused by the splice-blocking tenm3 MO, resulting in the deletion of Tenm3 transmembrane and extracellular domains. The full-length protein is represented on the left. The N terminus is located intracellularly, whereas the C terminus is in the extracellular space. (N–P) At 4 dpf, tenm3 morphant larvae fail to visually adapt their skin pigmentation to the level of background illumination. See also Figure S1. |

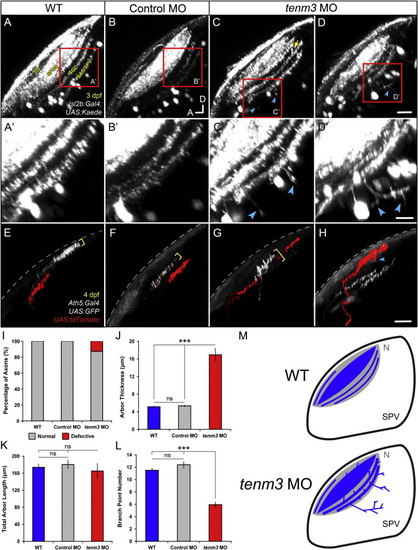
Teneurin-3 Is Required for Correct Stratification of RGC Dendrites (A–D) Kaede-expressing RGCs in the retina of 5 dpf WT, control MO-injected, and tenm3 MO-injected larvae. (A′–D′) Insets in (A)–(D) showing the dendritic stratification pattern of Kaede-positive RGCs. All images represent maximum intensity projections of ~20 μm confocal z stacks. Scale bars, 40 μm (A–D) and 20 μm in (A′–D′). GCL, ganglion cell layer; INL, inner nuclear layer; IPL, inner plexiform layer; OPL, outer plexiform layer. (E) Fluorescence profiles of IPL stratification in 5 dpf WT (blue), control MO-injected (gray), and tenm3 MO-injected (red) larvae. Thin traces represent intensity profiles of IPLs of single larvae. Thick traces indicate average profiles (WT, n = 7 larvae; control MO, n = 7; tenm3 MO, n = 10). Zero percent corresponds to the boundary between GCL and IPL, whereas 100% corresponds to the boundary between IPL and INL. (F) Schematic summarizing the defects observed in tenm3 morphant retinae. RGCs are indicated in blue. Neuropil layers are in gray. ONL, outer nuclear layer. See also Figure S4. |

Higher Proportion of RGCs with Diffuse Dendritic Arbors in teneurin-3 Morphants (A) Lateral view of mosaically labeled RGCs in the retina of a 5 dpf tenm3 MO-injected larva. Scale bar, 20 μm. GCL, ganglion cell layer; INL, inner nuclear layer; IPL, inner plexiform layer. (B) Bar graph showing the proportions of 5 dpf RGCs possessing monostratified (cyan, C), bistratified (green, D), multistratified (yellow, E), and diffuse (magenta, F) dendritic arbors relative to the total number mosaically labeled RGCs within each animal group (WT n = 89 cells in 34 larvae; control MO n = 92 cells in 39 larvae; tenm3 MO n = 98 cells in 49 larvae). (C–F) Representative RGCs with monostratified (C), bistratified (D), multistratified (E), and diffuse (F) dendritic arbors. All images represent maximum intensity projections of ~30 μm confocal z stacks that have been pseudocolored and rotated to best show dendritic arborizations. Scale bars, 20 μm. (G) Summary table showing the morphological classification and frequency of the 11 RGC types within each group (number of cells found per each type are reported in brackets). In tenm3 morphants, four diffuse RGCs (4.1% of cells) showed dendritic arborization patterns that could not be classified in any of the 11 types and, hence, were not included in the table. PHENOTYPE:
|
Higher Proportion of RGCs with Diffuse Dendritic Arbors in teneurin-3 Morphants (A) Lateral view of mosaically labeled RGCs in the retina of a 5 dpf tenm3 MO-injected larva. Scale bar, 20 μm. GCL, ganglion cell layer; INL, inner nuclear layer; IPL, inner plexiform layer. (B) Bar graph showing the proportions of 5 dpf RGCs possessing monostratified (cyan, C), bistratified (green, D), multistratified (yellow, E), and diffuse (magenta, F) dendritic arbors relative to the total number mosaically labeled RGCs within each animal group (WT n = 89 cells in 34 larvae; control MO n = 92 cells in 39 larvae; tenm3 MO n = 98 cells in 49 larvae). (C–F) Representative RGCs with monostratified (C), bistratified (D), multistratified (E), and diffuse (F) dendritic arbors. All images represent maximum intensity projections of ~30 μm confocal z stacks that have been pseudocolored and rotated to best show dendritic arborizations. Scale bars, 20 μm. (G) Summary table showing the morphological classification and frequency of the 11 RGC types within each group (number of cells found per each type are reported in brackets). In tenm3 morphants, four diffuse RGCs (4.1% of cells) showed dendritic arborization patterns that could not be classified in any of the 11 types and, hence, were not included in the table. EXPRESSION / LABELING:
PHENOTYPE:
|
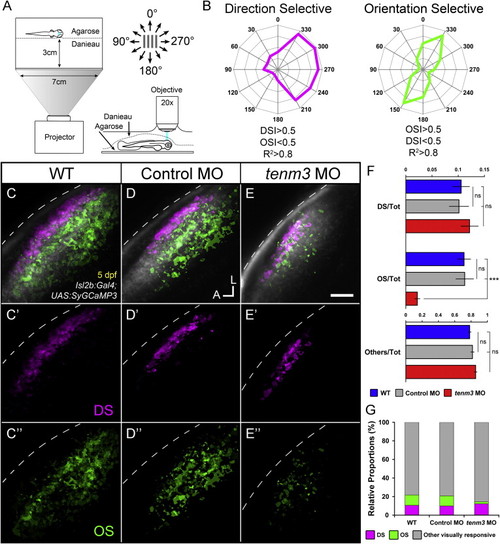
Impaired Development of Orientation-Selective RGCs Following teneurin-3 Knockdown (A) Schematic describing the experimental setup. Larvae were immobilized in agarose and placed with one eye facing a screen, where drifting bars moving in 12 directions were projected. Visually evoked SyGCaMP3 responses were recorded in the contralateral tectal neuropil. (B) Polar plots of representative direction-selective (DS, magenta) and orientation-selective (OS, green) voxels showing relative integral responses to moving bars. Criteria employed to characterize the two classes of voxels are reported at the bottom. (C-E) Composite parametric maps across multiple 5 dpf Tg(Isl2b:Gal4;UAS:SyGCaMP3) larvae representing the spatial distribution of DS (magenta) and OS (green) voxels within each group (WT n = 8 larvae; control MO n = 11; tenm3 MO n = 20). Within individual parametric maps, voxel brightness is proportional to the summed incidence of each functional response across all larvae imaged. The standard space template image derived for each group (grayscale) provides an anatomical reference. Dashed lines indicate the skin overlaying the tectum. Scale bar, 20 µm. A, anterior; L, lateral. (C′-E′) Parametric maps for DS voxels only. (C′′′-E′′) Parametric maps for OS voxels only. (F) Bar graphs showing the ratios between defined voxel classes and total visually responsive voxels (Tot) within each group (WT n = 8 larvae; control MO n = 11; tenm3 MO n = 20). Non-DS and non-OS voxels are classified as “others.” All graphs show mean values ± SEM. p < 0.001; ns, not significant by one-way ANOVA followed by Tukey’s HSD test. (G) Bar graph showing the proportions of DS and OS voxel classes relative to visually responsive voxels within each group.See also Figures S2-S4 and Movies S1, S2, and S3. |

RGC Functional Responses to Drifting Bars, Related to Figure 5 and Movies S1-S3 |
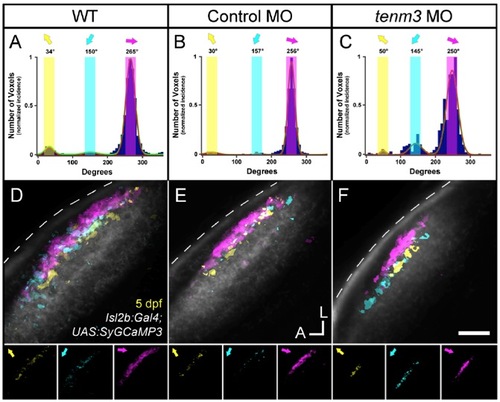
The Three Direction-Selective RGC Subtypes Are Not Affected by teneurin-3 Knock-Down, Related to Figure 5 |

Two Different Morpholino Oligonucleotides Against teneurin-3 Produce Equivalent Structural and Functional Results, Related to Figure 2, 4, 5 and S1 |